

Fill in the blanks in the following graph, which illustrates the decay curve of a radioactive element
Question:
Fill in the blanks in the following graph, which illustrates the decay curve of a radioactive element used to date fossil structures.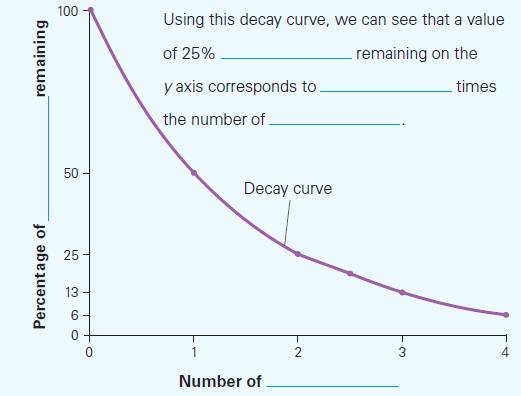
Fantastic news! We've Found the answer you've been seeking!
Step by Step Answer:
Percentage of parent element remaining 100 2...View the full answer

Answered By
Pushpinder Singh
Currently, I am PhD scholar with Indian Statistical problem, working in applied statistics and real life data problems. I have done several projects in Statistics especially Time Series data analysis, Regression Techniques.
I am Master in Statistics from Indian Institute of Technology, Kanpur.
I have been teaching students for various University entrance exams and passing grades in Graduation and Post-Graduation.I have expertise in solving problems in Statistics for more than 2 years now.I am a subject expert in Statistics with Assignmentpedia.com.
3+ Reviews
10+ Question Solved
Related Book For 

Biology Science For Life With Physiology
ISBN: 9780134555430
6th Edition
Authors: Colleen Belk, Virginia Maier
Question Posted:
