

Question: The MINITAB output given in Figure 8.39 is based on fitting a simple linear regression model relating hip circumference (????) to thigh circumference (????) using
The MINITAB output given in Figure 8.39 is based on fitting a simple linear regression model relating hip circumference (????) to thigh circumference (????) using the data in the Body Fat data set (???? = 252). Use the information in figure 8.39 to answer the following questions.
(a) Estimate the mean value of Hip when Thigh= 60.
(b) Compute a 95% confidence interval for the mean hip circumference of an adult male with a thigh circumference of 60 cm.
(c) Compute the value of the prediction error for predicting the value of hip circumference for an adult male with a thigh circumference of 60 cm.
(d) Compute a 95% prediction interval for the hip circumference of an adult male with a thigh circumference of 60 cm.
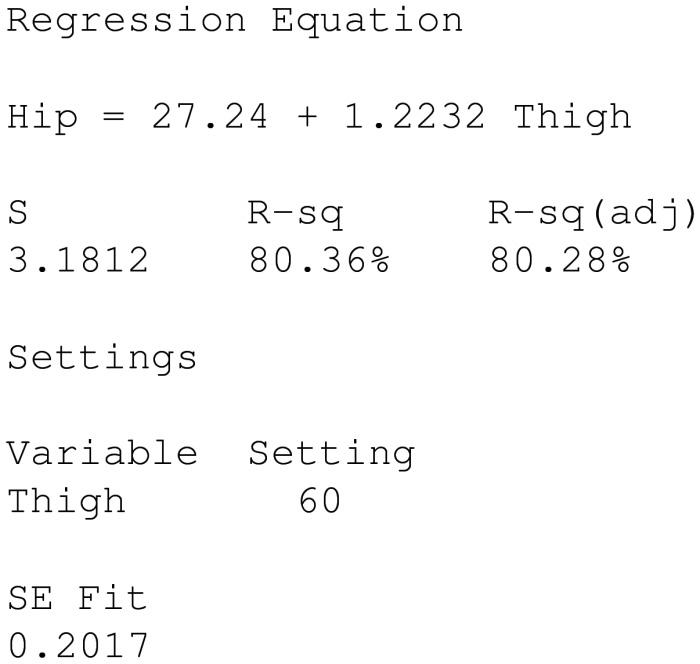
Regression Equation Hip = S 27.241.2232 Thigh R-sq R-sq (adj) 3.1812 80.36% 80.28% Settings Variable Thigh SE Fit 0.2017 Setting 60
Step by Step Solution
There are 3 Steps involved in it

Get step-by-step solutions from verified subject matter experts