Question: Using R is not compulsory (although encouraged) for the calculations involved in this prob- lem. No need to submit R code. Give typed or hand-written
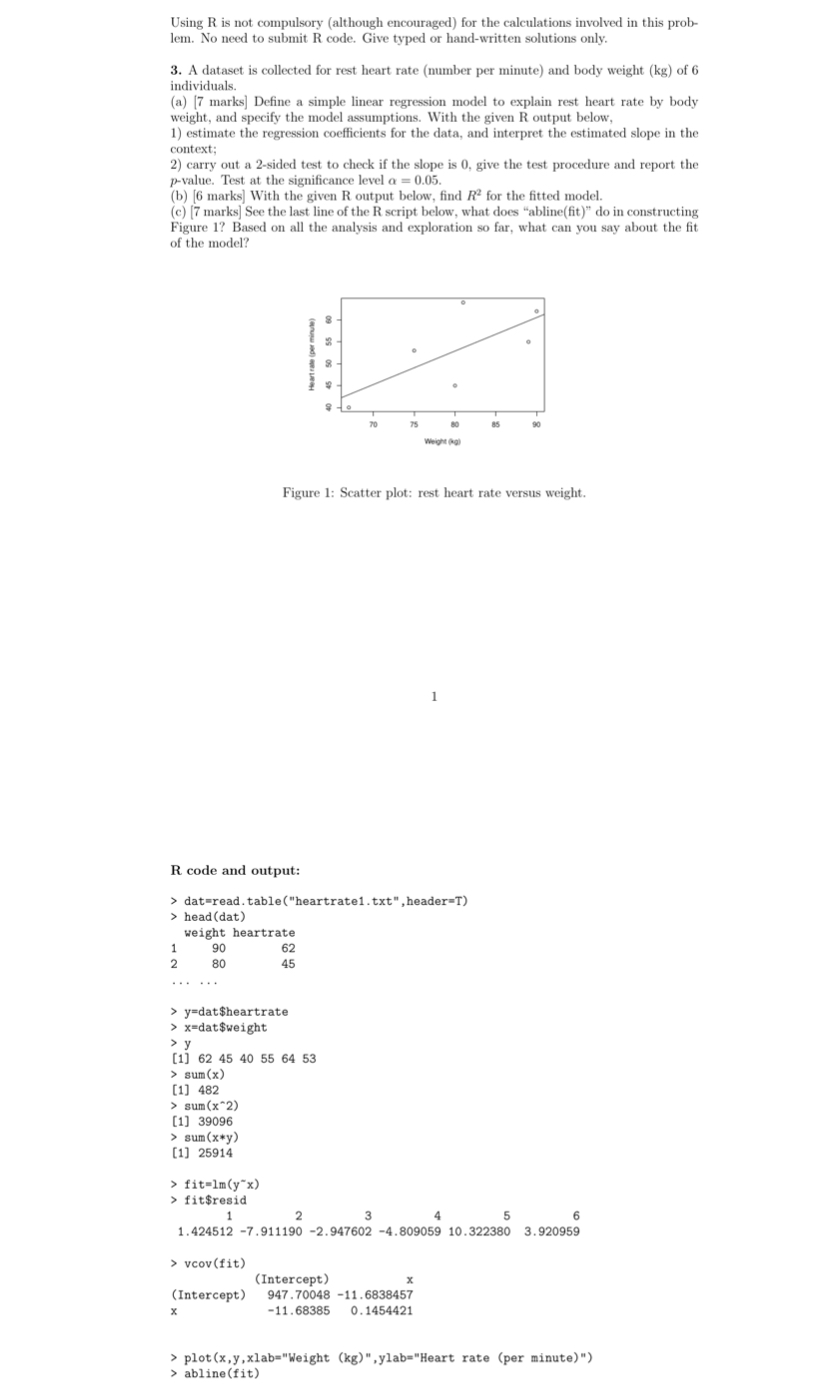
Using R is not compulsory (although encouraged) for the calculations involved in this prob- lem. No need to submit R code. Give typed or hand-written solutions only. 3. A dataset is collected for rest heart rate (number per minute) and body weight (kg) of 6 individuals. (a) (7 marks) Define a simple linear regression model to explain rest heart rate by body weight, and specify the model assumptions. With the given R output below, 1) estimate the regression coefficients for the data, and interpret the estimated slope in the context; 2) carry out a 2-sided test to check if the slope is 0, give the test procedure and report the p-value. Test at the significance level a = 0.05. (b) (6 marks) With the given R output below, find R for the fitted model. (c) 17 marks) See the last line of the R script below, what does "abline(fit)" do in constructing Figure 1? Based on all the analysis and exploration so far, what can you say about the fit of the model? We Figure 1: Scatter plot: rest heart rate versus weight. 1 R code and output: > dat=read.table("heartrate1.txt", header=T) > head (dat) weight heartrate 1 90 62 2 80 45 > y=dat$heartrate > x=dat$weight >y (11 62 45 40 55 64 53 > sum(x) (1) 482 > sum(x2) (1) 39096 > sum(x*y) (1) 25914 > fit-lm(y) > fit$resid 1 2 3 5 6 1.424512 -7.911190 -2.947602 -4.809059 10.322380 3.920959 > vcov(fit) (Intercept) (Intercept) 947.70048 -11.6838457 -11.68385 0.1454421 x > plot(x,y,xlab="Weight (kg)",ylab="Heart rate (per minute)") > abline(fit) Using R is not compulsory (although encouraged) for the calculations involved in this prob- lem. No need to submit R code. Give typed or hand-written solutions only. 3. A dataset is collected for rest heart rate (number per minute) and body weight (kg) of 6 individuals. (a) (7 marks) Define a simple linear regression model to explain rest heart rate by body weight, and specify the model assumptions. With the given R output below, 1) estimate the regression coefficients for the data, and interpret the estimated slope in the context; 2) carry out a 2-sided test to check if the slope is 0, give the test procedure and report the p-value. Test at the significance level a = 0.05. (b) (6 marks) With the given R output below, find R for the fitted model. (c) 17 marks) See the last line of the R script below, what does "abline(fit)" do in constructing Figure 1? Based on all the analysis and exploration so far, what can you say about the fit of the model? We Figure 1: Scatter plot: rest heart rate versus weight. 1 R code and output: > dat=read.table("heartrate1.txt", header=T) > head (dat) weight heartrate 1 90 62 2 80 45 > y=dat$heartrate > x=dat$weight >y (11 62 45 40 55 64 53 > sum(x) (1) 482 > sum(x2) (1) 39096 > sum(x*y) (1) 25914 > fit-lm(y) > fit$resid 1 2 3 5 6 1.424512 -7.911190 -2.947602 -4.809059 10.322380 3.920959 > vcov(fit) (Intercept) (Intercept) 947.70048 -11.6838457 -11.68385 0.1454421 x > plot(x,y,xlab="Weight (kg)",ylab="Heart rate (per minute)") > abline(fit)


