

Question: A two-sample test for means was conducted to test whether the mean number of movies watched each month differed between males and females. The Excel
A two-sample test for means was conducted to test whether the mean number of movies watched each month differed between males and females. The Excel Data Analysis tool results are shown below.
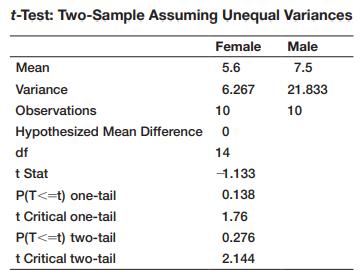
a. Explain how to use this information to draw a conclusion if the null hypothesis is H0: μF - μM ≤ 0. Clearly state the correct critical value and p-value and your conclusion.
b. Explain how to use this information to draw a conclusion if the null hypothesis is H0: μF - μM ≥ 0. Clearly state the correct critical value and p-value and your conclusion.
c. Explain how to use this information to draw a conclusion if the null hypothesis is H0: μF - μM = 0. Clearly state the correct critical value and p-value and your conclusion.
t-Test: Two-Sample Assuming Unequal Variances Female Male 5.6 7.5 6.267 21.833 10 Mean Variance Observations Hypothesized Mean Difference df t Stat P(T
Step by Step Solution
3.43 Rating (169 Votes )
There are 3 Steps involved in it
tTest TwoSample Assuming Unequa... View full answer

Get step-by-step solutions from verified subject matter experts