

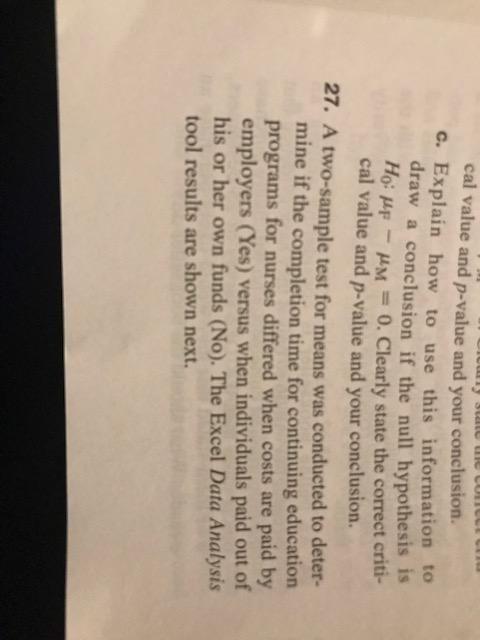
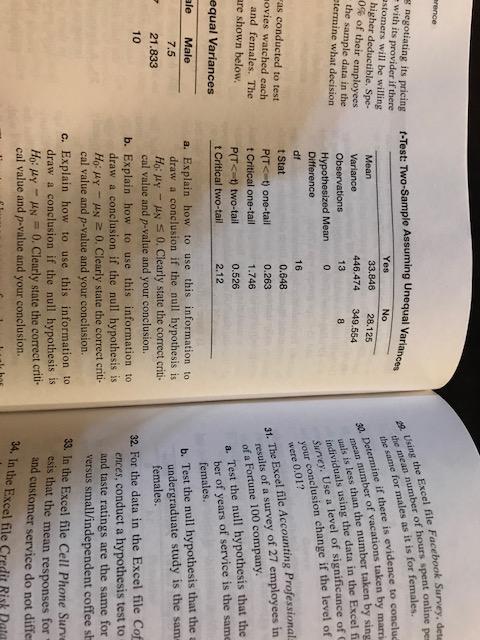
Question: Question #27: Solution here: S SCULE cal value and p-value and your conclusion. c. Explain how to use this information to draw a conclusion if
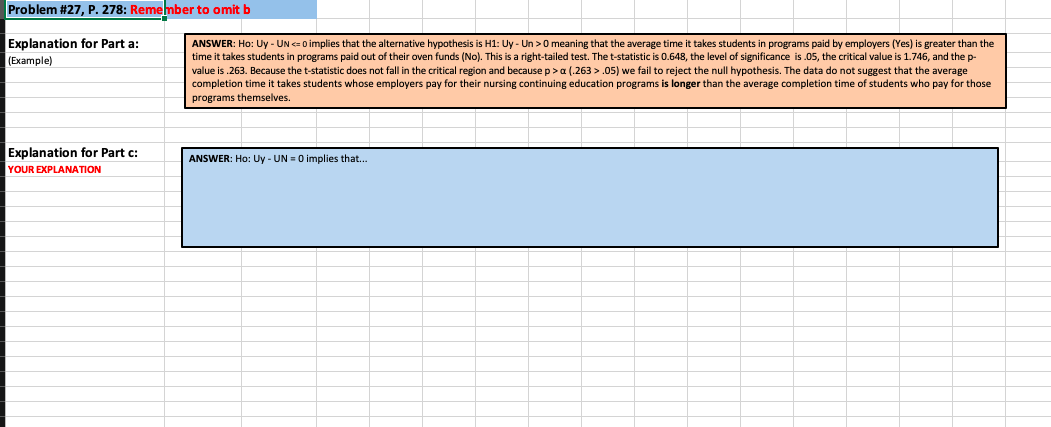
Question #27:
Solution here:
Step by Step Solution
There are 3 Steps involved in it
1 Expert Approved Answer
Step: 1 Unlock

Question Has Been Solved by an Expert!
Get step-by-step solutions from verified subject matter experts
Step: 2 Unlock
Step: 3 Unlock