

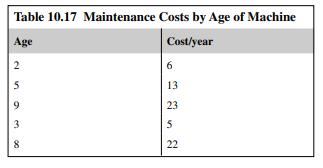
Question: Consider the data shown in Table 10.17, representing ages in years and maintenance costs (in thousands of dollars per year) for five similar printing presses.
Consider the data shown in Table 10.17, representing ages in years and maintenance costs
(in thousands of dollars per year) for five similar printing presses.
a. Create a scatter plot of the data. Describe the relationship.
b. Find the correlation between age and maintenance cost. What is the managerial interpretation?
c. Find the least-square regression equation. Is there a statistically significant relationship between the variables? If so, then what is the managerial interpretation of the regression coefficients?
d. What would you expect the annual maintenance costs to be for a press that is 7 years old?
e. What is the typical size for the prediction errors; that is, what is the distribution of the errors and how does that affect the distribution of the predicted costs?
f. How much of the variation in maintenance costs can be attributed to the age of the press?
5 9 3 Table 10.17 Maintenance Costs by Age of Machine Age 2 Cost/year 6 5 22 13 23
Step by Step Solution
There are 3 Steps involved in it

Get step-by-step solutions from verified subject matter experts