

Question: Construct an influence diagram for the portfolio allocation model in Example 11.15 Data from Example 11.15 An investor has $100,000 to invest in four assets.
Construct an influence diagram for the portfolio allocation model in Example 11.15
Data from Example 11.15
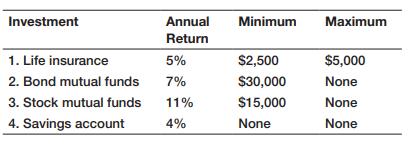
An investor has $100,000 to invest in four assets. The expected annual returns and minimum and maximum amounts with which the investor will be comfortable allocating to each investment are as follows:
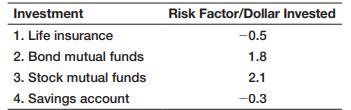
Let us assume that the risk factors per dollar allocated to each asset have been determined as follows:
Investment 1. Life insurance 2. Bond mutual funds 3. Stock mutual funds 4. Savings account Annual Return 5% 7% 11% 4% Minimum $2,500 $30,000 $15,000 None Maximum $5,000 None None None
Step by Step Solution
3.51 Rating (154 Votes )
There are 3 Steps involved in it
Portfolio Allocation Model Acceptable sol... View full answer

Get step-by-step solutions from verified subject matter experts