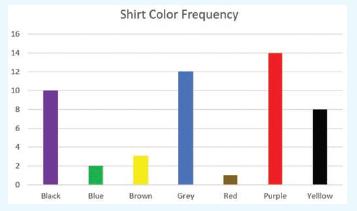
Question: Data visualization should help companies understand how they are performing. The following data visualization was designed to answer this question: How many thousands of shirts
Data visualization should help companies understand how they are performing. The following data visualization was designed to answer this question: “How many thousands of shirts of each color were produced during the month?” How well does this data visualization answer this question, and how clearly does it present the results? Which branch of operations would this data visualization apply to? What type of analytics question is the data visualization answering?
16 14 12 10 B 2 Black Blue Shirt Color Frequency Brown Grey Red Purple Yelllow
Step by Step Solution
3.48 Rating (158 Votes )
There are 3 Steps involved in it
The data visualization is not very good It does show the number o... View full answer

Get step-by-step solutions from verified subject matter experts


