

Question: Lets analyze the transactions by product (SKU). Create a pivot table in Excel showing how many units were sold for each SKU. Use the pivot
Let’s analyze the transactions by product (SKU). Create a pivot table in Excel showing how many units were sold for each SKU. Use the pivot table to answer the following questions:
a. Which product (SKU) sold the most units?
b. Which product (SKU) sold the fewest units?
c. Using PivotChart, create the recommended Cluster Column chart showing the number of products sold for each SKU. Is the chart a histogram or a bar chart? Explain your answer.
Pivot table 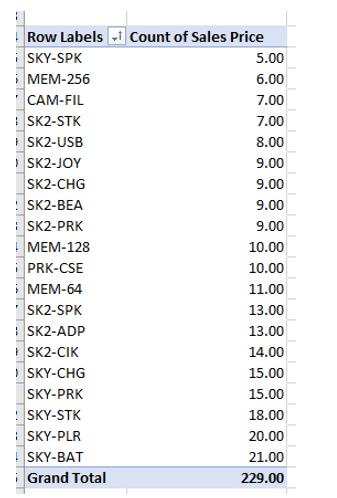
Row Labels Count of Sales Price SKY-SPK MEM-256 CAM-FIL SK2-STK SK2-USB SK2-JOY SK2-CHG ! SK2-BEA SK2-PRK MEM-128 PRK-CSE MEM-64 *SK2-SPK SK2-ADP SK2-CIK SKY-CHG SKY-PRK SKY-STK SKY-PLR SKY-BAT Grand Total 5.00 6.00 7.00 7.00 8.00 9.00 9.00 9.00 9.00 10.00 10.00 11.00 13.00 13.00 14.00 15.00 15.00 18.00 20.00 21.00 229.00
Step by Step Solution
3.37 Rating (153 Votes )
There are 3 Steps involved in it
a SKYBAT b SKYBAT c Count of Sales Price 2500 2000 1500 100... View full answer

Get step-by-step solutions from verified subject matter experts