

Question: Lets analyze the sales transactions by SKU. Create a pivot table in Excel showing the average sales price, cost, gross margin, gross margin percentage for
Let’s analyze the sales transactions by SKU. Create a pivot table in Excel showing the average sales price, cost, gross margin, gross margin percentage for each SKU. For ease of use, format all numbers with two decimals. Use the pivot table to answer the following questions:
a. How many SKUs are there?
b. Which SKU has the highest average selling price?
c. Which SKU has the lowest average cost?
d. Which SKU has the highest average gross margin?
e. Which SKU has the highest average gross margin percentage?
f. What is the Grand Total, or overall, average gross margin percentage?
g. How can management use the information in the pivot table?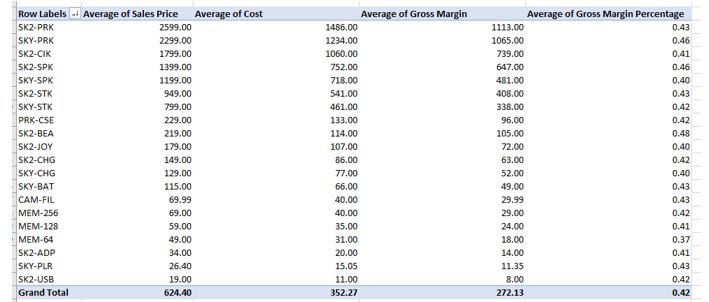
Row Labels Average of Sales Price 2599.00 2299.00 1799.00 SK2-PRK SKY-PRK SK2-CIK SK2-SPK SKY-SPK SK2-STK SKY-STK PRK-CSE SK2-BEA SK2-JOY SK2-CHG SKY-CHG SKY-BAT CAM-FIL MEM-256 MEM-128 MEM-64 SK2-ADP SKY-PLR SK2-USB Grand Total 1399.00 1199.00 949.00 799.00 229.00 219.00 179.00 149.00 129.00 115.00 69.99 69.00 59.00 49.00 34.00 26.40 19.00 624.40 Average of Cost 1486.00 1234.00 1060.00 752.00 718.00 541.00 461.00 133.00 114.00 107.00 86.00 77.00 66.00 40.00 40.00 35.00 31.00 20.00 15.05 11.00 352.27 Average of Gross Margin 1113.00 1065.00 739.00 647.00 481.00 408.00 338.00 96.00 105.00 72.00 63.00 52.00 49.00 29.99 29.00 24.00 18.00 14.00 11.35 8.00 272.13 Average of Gross Margin Percentage 0.43 0.46 0.41 0.46 0.40 0.43 0.42 0.42 0.48 0.40 0.42 0.40 0.43 0.43 0.42 0.41 0.37 0.41 0.43 0.42 0.42
Step by Step Solution
3.44 Rating (160 Votes )
There are 3 Steps involved in it
a 20 b SK2PRK c SK2USB d SK2USB e SK2BEA f 042 or 42 g A su... View full answer

Get step-by-step solutions from verified subject matter experts