

Management accountants can use the following table to perform a sensitivity analysis, evaluating the companys changing profitability
Question:
Management accountants can use the following table to perform a sensitivity analysis, evaluating the company’s changing profitability based on two important inputs: (1) the level of total fixed costs and (2) the sales price of the product. Note that the analysis varies the sales price from $35 to $53 (as shown in the columns) and the fixed costs from $500 to $3,000 (as shown in the rows). Total sales are constant at 300 units and the variable costs are constant at $20 per unit. The colored columns are the total profits based on the changing input parameters.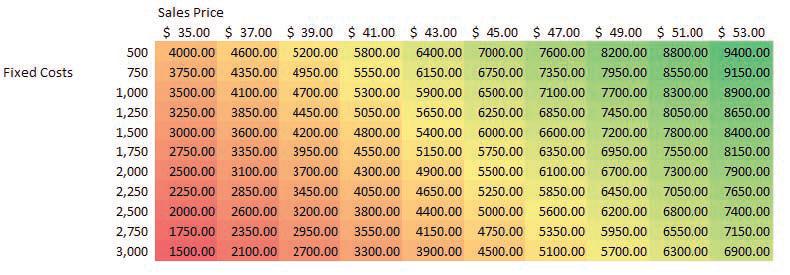
Required
a. As sales price increases, what happens to the estimated profitability?
b. As total fixed costs increase, what happens to the estimated profitability?
c. If the sales price is $53 and total fixed costs are $3,000, what is the estimated profitability?
d. If the sales price is $45 and total fixed costs are $500, what is the estimated profitability?
Step by Step Answer:
a As sales price increases the estimated profitability generally increases This can be observed by c...View the full answer


Introduction To Business Analytics
ISBN: 9781265454340
1st Edition
Authors: Vernon Richardson, Marcia Watson
