

Question: Using the exhibit and description in Problem 7 above, evaluate the sensitivity ofn profits to changing levels of fixed costs and product sales price. Required
Using the exhibit and description in Problem 7 above, evaluate the sensitivity ofn profits to changing levels of fixed costs and product sales price.
Required
a. Which has a greater impact on profitability, a $2 increase in sales price or a $250 decrease in total fixed costs?
b. How does conditional formatting help you to visualize the impact of these two important inputs on estimated profitability?
c. Would you recommend a different coloring scheme than the red-yellow green scheme? Why or why not?
d. What other inputs do you think would be relevant to evaluate in assessing profitability?
Exhibit and description Problem 7
Management accountants can use the following table to perform a sensitivity analysis, evaluating the company’s changing profitability based on two important inputs: (1) the level of total fixed costs and (2) the sales price of the product. Note that the analysis varies the sales price from $35 to $53 (as shown in the columns) and the fixed costs from $500 to $3,000 (as shown in the rows). Total sales are constant at 300 units and the variable costs are constant at $20 per unit.The colored columns are the total profits based on the changing input parameters.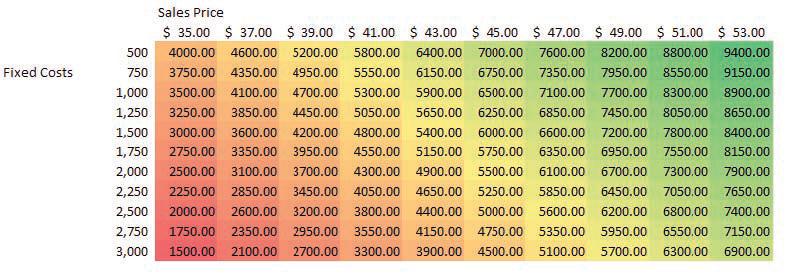
Fixed Costs Sales Price 500 $ 35.00 $37.00 $39.00 $ 41.00 $43.00 $45.00 $47.00 $49.00 $ 51.00 $ 53.00 4000.00 4600.00 5200.00 5800.00 6400.00 7000.00 7600.00 8200.00 8800.00 9400.00 750 3750.00 4350.00 4950.00 5550.00 6150.00 6750.00 7350.00 7950.00 8550.00 9150.00 1,000 3500.00 4100.00 4700.00 5300.00 5900.00 6500.00 7100.00 7700.00 8300.00 8900.00 1,250 3250.00 3850.00 4450.00 5050.00 5650.00 6250.00 6850.00 7450.00 8050.00 8650.00 1,500 3000.00 3600.00 4200.00 4800.00 5400.00 6000.00 6600.00 7200.00 7800.00 8400.00 1,750 2750.00 3350.00 3950.00 4550.00 5150.00 5750.00 6350.00 6950.00 7550.00 8150.00 2,000 2500.00 3100.00 3700.00 4300.00 4900.00 5500.00 6100.00 6700.00 7300.00 2,250 2250.00 2850.00 3450.00 4050.00 4650.00 5250.00 5850.00 6450.00 7050.00 2,500 2000.00 2600.00 3200.00 3800.00 4400.00 5000.00 5600.00 2350.00 2950.00 3550.00 4150.00 4750.00 5350.00 5950.00 6550.00 2100.00 2700.00 3300.00 3900.00 4500.00 5100.00 5700.00 6300.00 6900.00 7900.00 7650.00 6200.00 6800.00 7400.00 2,750 1750 7150.00 3,000 1500.00
Step by Step Solution
3.51 Rating (161 Votes )
There are 3 Steps involved in it
a To evaluate the impact on profitability we need to compare the changes in total profits resulting from a 2 increase in sales price and a 250 decrease in total fixed costs To do this we can select tw... View full answer

Get step-by-step solutions from verified subject matter experts