

Question: The following 20 observations are for two quantitative variables, x and y. a. Create a scatter chart for these 20 observations. b. Fit a linear
The following 20 observations are for two quantitative variables, x and y.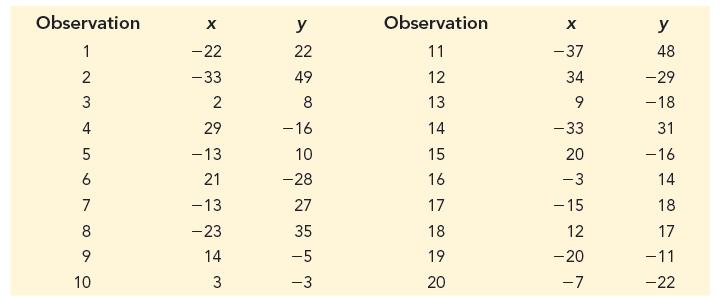
a. Create a scatter chart for these 20 observations.
b. Fit a linear trendline to the 20 observations. What can you say about the relationship between the two quantitative variables?
Observation y Observation y 1 -22 22 11 -37 48 23 2 -33 49 12 34 -29 2 8 13 9 -18 4 29 -16 14 -33 31 5 -13 10 15 20 -16 6 21 -28 16 -3 14 7 -13 27 17 -15 18 8 -23 35 18 12 17 9 14 -5 19 -20 -11 10 3 -3 20 -7 -22
Step by Step Solution
There are 3 Steps involved in it
1 Expert Approved Answer
Step: 1 Unlock

Question Has Been Solved by an Expert!
Get step-by-step solutions from verified subject matter experts
Step: 2 Unlock
Step: 3 Unlock