

Question: Hi, there. Can you please help me to understand this exercise, please. EXERCISES Methods 36. The following 20 observations are for two quantitative variables, x
Hi, there.
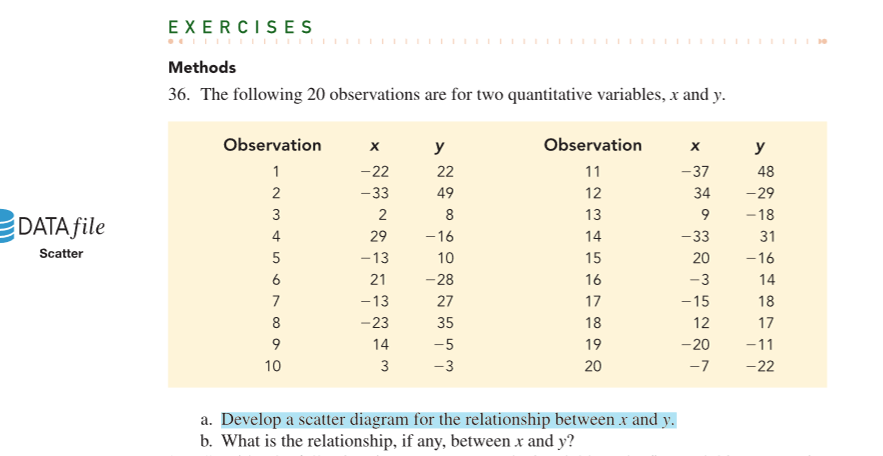
Can you please help me to understand this exercise, please.


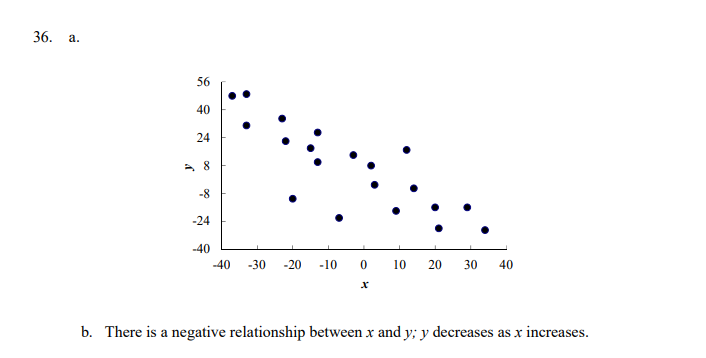
EXERCISES Methods 36. The following 20 observations are for two quantitative variables, x and y. Observation X Observation X y -22 22 11 -37 48 -33 49 12 34 -29 13 9 DATAfile 2 8 -18 29 - 16 14 -33 31 Scatter -13 10 15 20 -16 O 0 0 4 0 UP WN- 21 28 16 -3 14 -13 27 17 -15 18 -23 35 18 12 17 14 -5 19 -20 -11 3 -3 20 -7 -22 a. Develop a scatter diagram for the relationship between x and y. b. What is the relationship, if any, between x and y?36. a. 56 40 24 2 8 -8 -24 -40 40 -30 -20 -10 0 10 20 30 40 X b. There is a negative relationship between x and y; y decreases as x increases
Step by Step Solution
There are 3 Steps involved in it

Get step-by-step solutions from verified subject matter experts