

Question: The scatter chart in the following figure was created using sample data for profits and market capitalizations from a sample of firms in the Fortune
The scatter chart in the following figure was created using sample data for profits and market capitalizations from a sample of firms in the Fortune 500.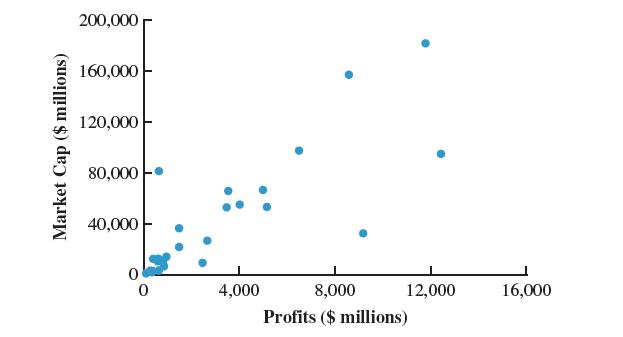
a. Discuss what the scatter chart indicates about the relationship between profits and market capitalization?
b. The data used to produce this are contained in the file fortune500. Calculate the covariance between profits and market capitalization. Discuss what the covariance indicates about the relationship between profits and market capitalization?
c. Calculate the correlation coefficient between profits and market capitalization. What does the correlation coefficient indicate about the relationship between profits and market capitalization?
Market Cap ($ millions) 200,000 160,000 120,000 80,000 40,000 0 0 4,000 8,000 Profits ($ millions) 12,000 16,000
Step by Step Solution
3.53 Rating (150 Votes )
There are 3 Steps involved in it

Get step-by-step solutions from verified subject matter experts