

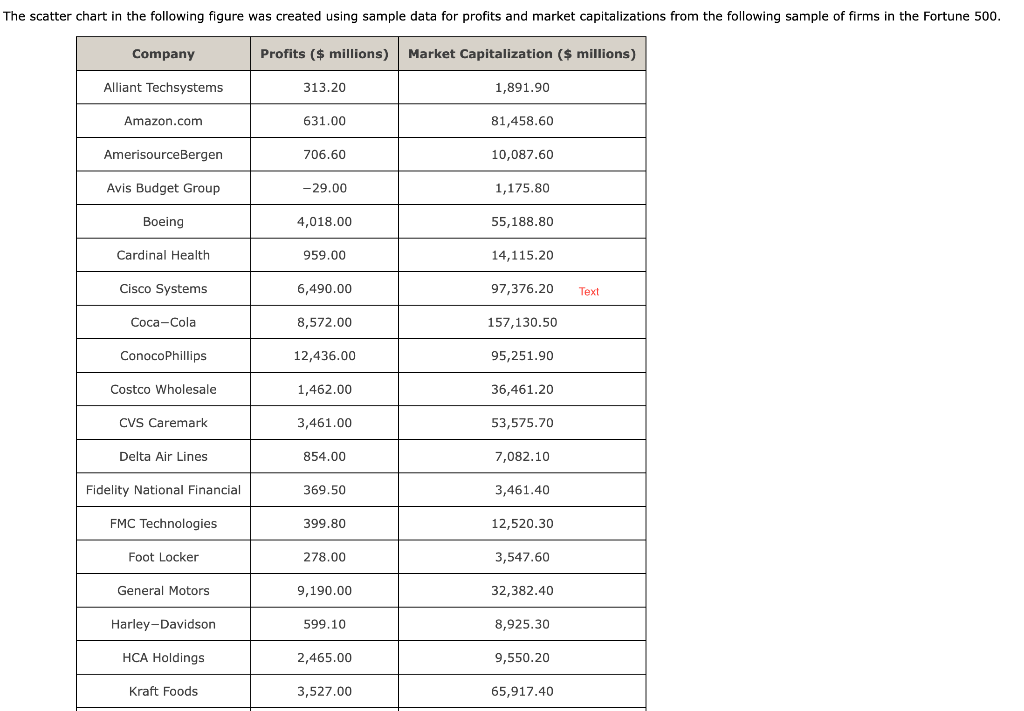
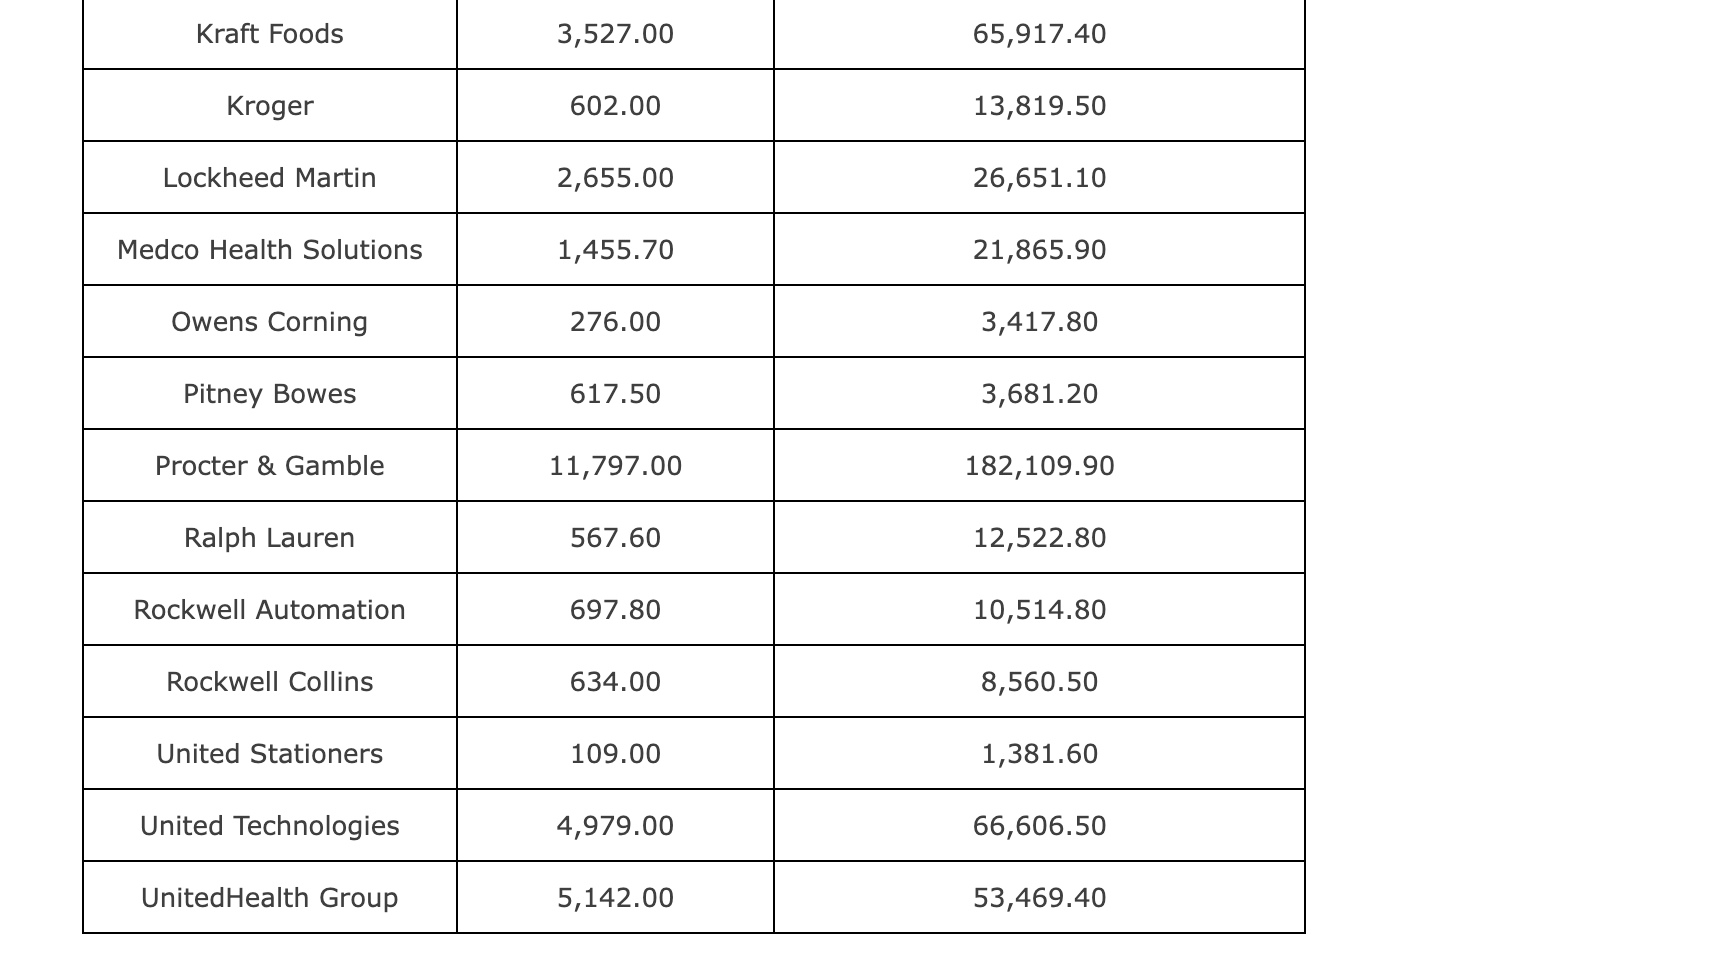
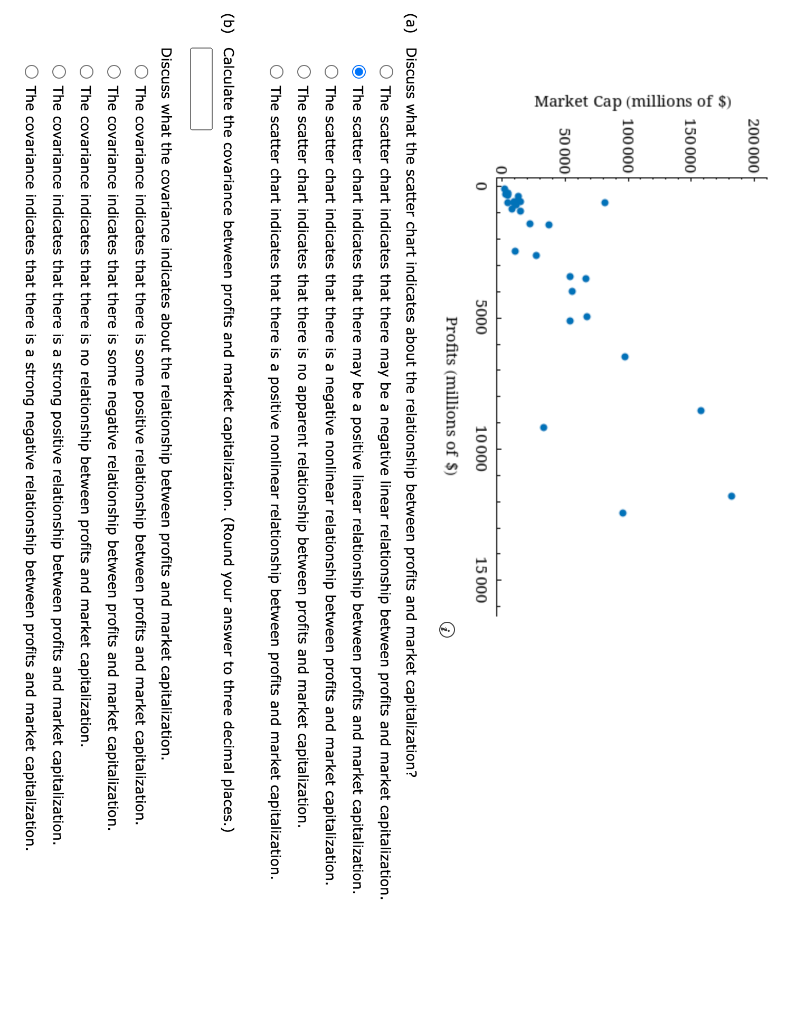
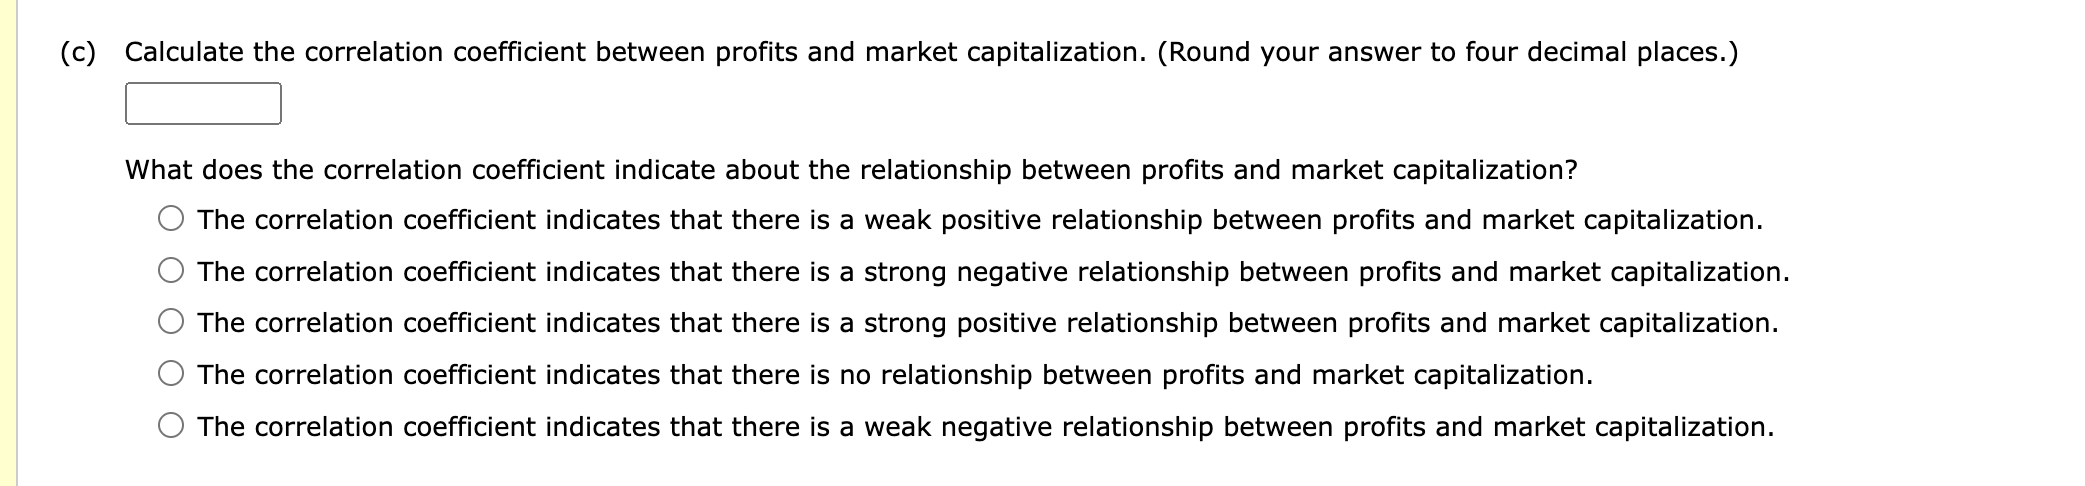
Question: The scatter chart in the following figure was created using sample data for profits and market capitalizations from the following sample of firms in the
Step by Step Solution
There are 3 Steps involved in it
1 Expert Approved Answer
Step: 1 Unlock

Question Has Been Solved by an Expert!
Get step-by-step solutions from verified subject matter experts
Step: 2 Unlock
Step: 3 Unlock