

Question: Given the data below on the characteristics of shirt brands construct a diagram in characteristic space showing: ^ The choice facing the consumer in terms
Given the data below on the characteristics of shirt brands construct a diagram in characteristic space showing:
^ The choice facing the consumer in terms of brands.
^ The e⁄ciency frontier.
^ Which brands are ine⁄cient and which e⁄cient?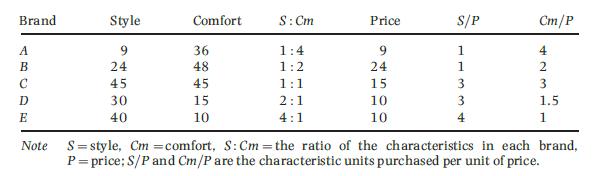
^ What additional information is required to determine an optimal position for a consumer?
^ Given the data above, suppose PA rises to »12. What happens to the e⁄ciency frontier?
^ What are the similarities and di¡erences between traditional and characteristic models in the optimal position of a consumer?
^ A new brand of shirt (F) is introduced. If the shirt possesses 40 units of S and 30 units of Cm and is priced at »10, what happens to the e⁄ciency frontier?
Brand Style Comfort S: Cm Price S/P Cm/P ABCDE 24 241 9 36 1:4 9 1 4 48 1:2 24 1 2 45 45 1:1 15 3 3. 30 15 2:1 10 3 1.5 40 10 4:1 10 4 1 Note S style, Cm comfort, S: Cm the ratio of the characteristics in each brand, P price; S/P and Cm/P are the characteristic units purchased per unit of price.
Step by Step Solution
There are 3 Steps involved in it

Get step-by-step solutions from verified subject matter experts