New Semester
Started
Get
50% OFF
Study Help!
--h --m --s
Claim Now
Question Answers
Textbooks
Find textbooks, questions and answers
Oops, something went wrong!
Change your search query and then try again
S
Books
FREE
Study Help
Expert Questions
Accounting
General Management
Mathematics
Finance
Organizational Behaviour
Law
Physics
Operating System
Management Leadership
Sociology
Programming
Marketing
Database
Computer Network
Economics
Textbooks Solutions
Accounting
Managerial Accounting
Management Leadership
Cost Accounting
Statistics
Business Law
Corporate Finance
Finance
Economics
Auditing
Tutors
Online Tutors
Find a Tutor
Hire a Tutor
Become a Tutor
AI Tutor
AI Study Planner
NEW
Sell Books
Search
Search
Sign In
Register
study help
business
introductory financial accounting
Financial Accounting The Cornerstone Of Business Decision Making 5th Edition Jay S Rich, Jeff Jones, Linda Ann Myers - Solutions
Write a SAS program to analyze the responses for Exercise 8.5, defining the dummy variables by effects coding.
For data of Example 7.1, obtain the reference cell regression model for the analysis of the experimental responses by assuming that the reference cell is(2, 1). Obtain the estimates for the model and the equation for the fitted model. Obtain the estimated responses, extract the residuals, and
Write SAS program to carry out the analysis required for Exercise 8.1.
Write a SAS program to carry out the analysis required for Exercise 8.2.
Write a SAS program to analyze the responses of Example 7.1, according to the regression model suggested in Exercise 8.7.
A 23 factorial experiment was performed to study the yield of a chemical plant under two levels of A (pressure) B (temperature), and C (catalyst concentration).However, because it was not possible to run a full replicate each, using the same shift of workers, it was decided to run four replicates
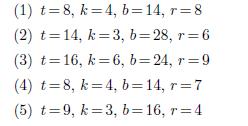
Which of the following proposed designs can be constructed as BIBDs? For those identified as BIBDs, write down the assignment of units into blocks. (1) t=8, k=4, b=14, r=8 (2) t=14, k=3, b=28, r=6 (3) t=16, k=6, b=24, r=9 (4) t=8, k=4, b=14, r=7 (5) t=9, k=3, b=16, r=4
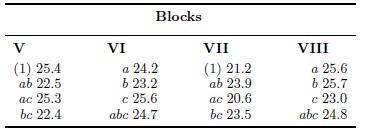
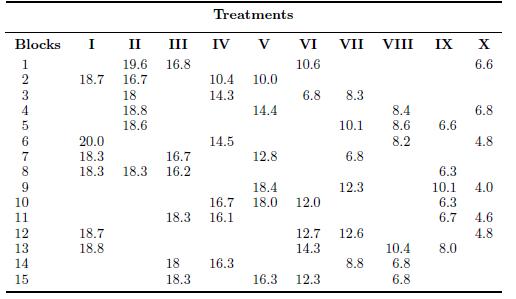
An industrial experiment was performed that involved 10 treatments for which a BIBD could only be accomplished in 15 shifts. Write down the model for this design. The responses for the experiment are as follows:Analyze the data and draw conclusions. Take the level of significance to be 5%. Was it
Three groups of children subjected to the same instruction (grouped by social strata) were studied for keyboard skills. The ages of the children were taught to affect the outcomes (number of words typed per minute), so a one-way ANCOVA was used for the study, and the responses are as follows:Using
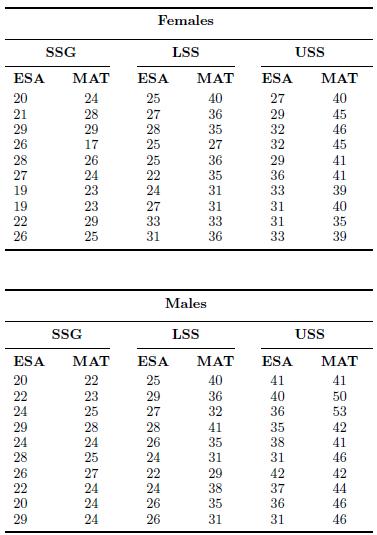
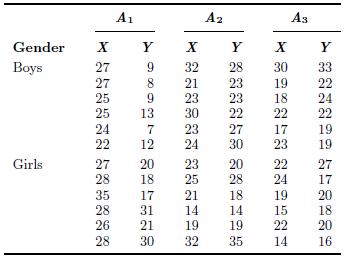
In devising a test for interviewing engineers for company scholarship, an oil company studied three grades of students to see whether engineering aptitude differed between them. They were also interested in finding out whether there was any difference in the performances of female and male
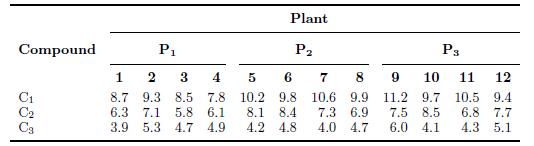
Three compounds (C1, C2, C3) useful for the drug production could be extracted from three plants (P1, P2, P3), which grow in different parts of the world. Four technicians were chosen at random from each of three different laboratories in those parts of the world to determine the percentages of the
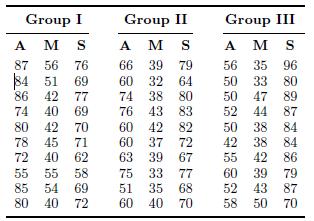
An experiment was performed to study three different methods of teaching pupil’s arithmetical skills of addition (A), multiplication (M), and subtraction(S). The scores obtained from different groups of pupils used in the experiment are presented below as follows:Can it be said that any of the
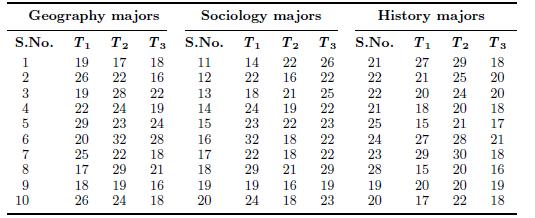
Ten students from each of three disciplines, geography, sociology, and history were selected at random to participate in a study whose aim was to find out whether a person’s major field of study affects his or her intellectual ability to perceive some basic concepts. They were subjected to three
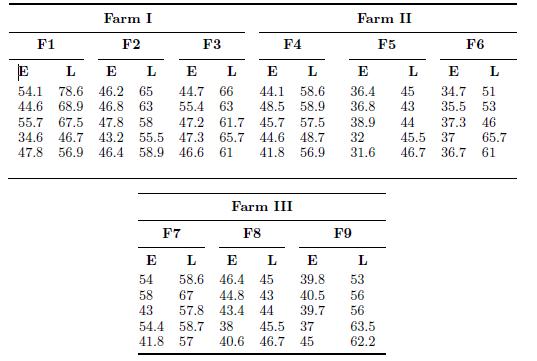
A research was carried out into the yield of paw-paw under nine fertilizer treatments in three different experimental farms. However, only three of the fertilizers were used exclusively in each of the three farms, so that fertilizer treatments were nested within farms. The following data represent
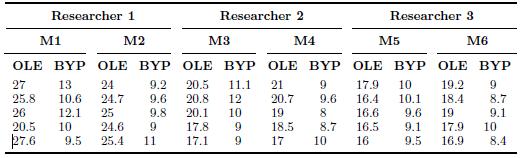
Six methods were available to be used to extract Oleoresin (OLE) and a byproduct (BYP), from ginger. Three researchers, each uses two of the methods to make determinations of the ginger content of OLE and BYP leading to nested design. The percentages of OLE and BYP obtained are presented in the
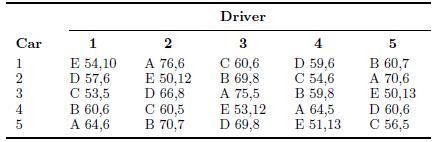
A car manufacturer concerned about two issues: rising cost of fuel and pollution from car emissions, decided to produce more fuel-efficient cars. He carried out an experiment to test a set of five prototypes of burners he designed, which were to be fitted to the new generation of cars he wished to
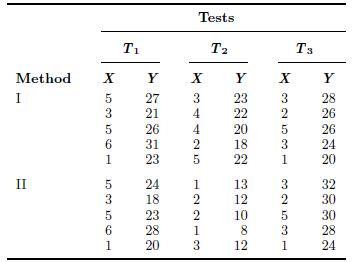
In a study conducted in a textile training establishment, it was assumed that the number of months of training of the apprentices would affect their performances in the three tests, T1, T2, and T3, which were administered. In instructing the apprentices, two methods, A and B, were used. Their
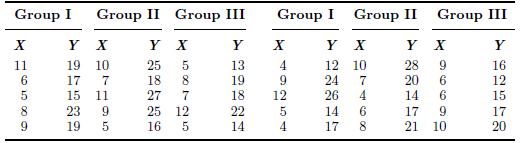
A group of pupils were divided into three groups and subjected to three new methods of learning basic mathematics, however, it is thought that their previous performances in arithmetic (X) in the previous year affected their performances after the course (Y ). To see whether there is a differential
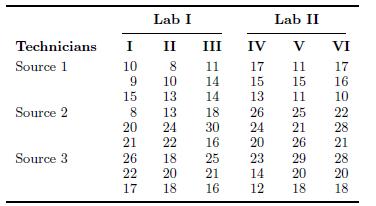
Two laboratories were used to determine the purity of a chemical compound synthesized from three sources. Within each of these laboratories, three technicians were used to carry out the analysis.Analyze the data and state your conclusions. Lab I Lab II Technicians I II III IV V VI Source 1 10 8 11
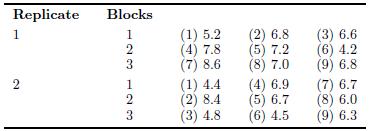
Suppose that only a simple lattice was studied for Example 10.2 leading to the following data. Analyze the responses of the experiment and reach conclusion. Replicate Blocks 1 2 123 123 (1) 5.2 (2) 6.8 (3) 6.6 (4) 7.8 (5) 7.2 (6) 4.2 (7) 8.6 (8) 7.0 (9) 6.8 (1) 4.4 (4) 6.9 (7) 6.7 (2) 8.4 (5) 6.7
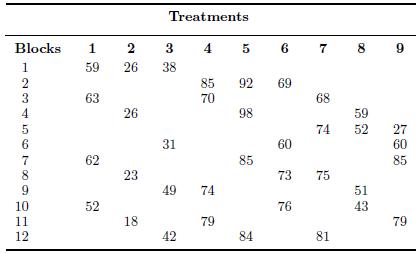
The data below present the yield of alfalfa under nine different fertilizer treatments, studied in 12 incomplete blocks leading to a BIBD.Analyze the data and determine whether treatment and block are significant at 5%. Obtain estimates of treatment effects. Treatments Blocks 1 2 3 4 5 6 7 8 9 10
A gage repeatability experiment was performed by Lexon Corporation using three instruments to measure parts set to diameter of 20 mm. It was thought that operator differences might affect the outcomes. Each of three operators used three of the same type of instrument to make four determinations of
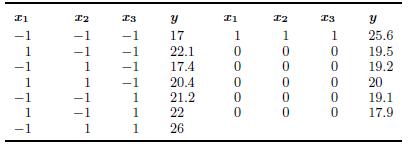
After some steps in the path of steepest ascent, a chemical process represented by 23 factorial design was augmented with five measurements at the center.Fit a first-order model to the data and determine whether the model fits. #1 22 23 21 I2 I3 y -1 -1 1 17 1 1 1 25.6 1 22.1 0 0 0 19.5 1 17.4 0 0
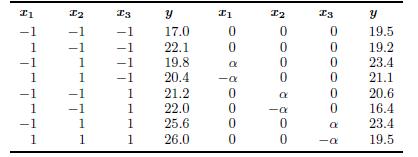
In Example 11.1, suppose that a second system manager instead of using an orthogonal design choose a rotatable design and obtain the α for his/her design. The responses of the process after the rotatable design was chosen are presented below.Fit a second-order model to the design and perform the
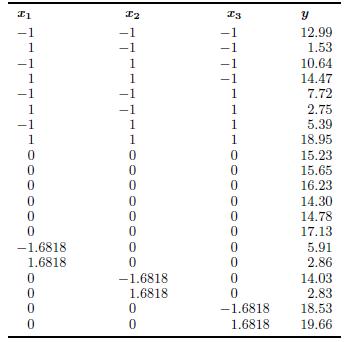
In exploring the response surface of a process involving three factors, it was decided to use a rotatable 23 CCD to fit a second order model around the point where lack of fit was significant for a first order model. The responses obtained at the points chosen are as follows:Fit a second-order
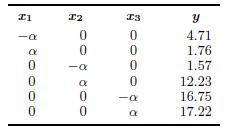
Suppose that in Exercise 11.3, instead of a rotatable CCD an orthogonal design was used so that the following data were obtained for the star points:Determine the value of α and hence fit the second-order model and perform the canonical analysis. Compare your conclusions about the nature of the
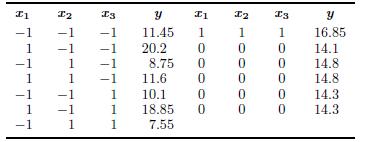
In a study to explore the effect of small increases in the sizes of the three factors that are believed to influence the response of a process, the following data were obtained.Fit a first-order model to the data and determine the next action to be taken. 21 I2 3 y I1 I2 T3 y -1 -1 -1 11.45 1 1 1
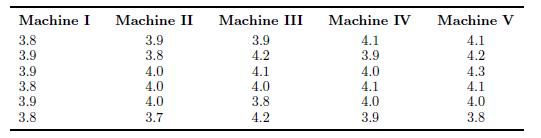
Five machines were designed to produce steel pipes whose diameters are to be approximately 4.0 cm. In a pilot study, six pipes produced by each machine as in the table here were chosen at random and their diameters measured. Is there any difference between the diameters of the pipes produced by
Write a SAS program to carry out the analysis of Exercise 3.7.
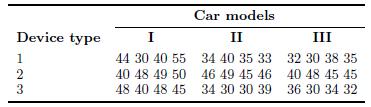
A car manufacturer is studying three devices for reducing fuel consumption using three different models of the car to be fitted with the devices. The data obtained are as follows: Analyze the data as a full two-factor factorial design and test for significance of all effects at 1% level of
In the data of Exercise 3.8, obtain the fitted values and extract the residuals for the analysis carried out in Exercise 3.8. Using the residuals, test whether the normality assumption is satisfied. Using the test of Bartlett (1936), determine whether the assumption of homogeneity of variance is
Write a SAS program to analyze the data of Exercise 3.8, assuming the fixed effects model.
Write a SAS program to analyze the data of Exercise 3.3 using the GLM procedure.
Define the dummy variables by reference cell method, using cell (4,3) as the reference cell, and obtain a regression model for the Akwette cloth design of Example 3.1. Estimate the model parameters, obtain the estimated responses, extract the residuals for the fitted model by manual methods, and
Write a SAS program using the model of Exercise 4.1 to carry out the analysis of the data described in Exercise 4.1.
Using cell reference method to define the dummy variables, with cell (3,3)as the reference cell obtain the regression model for the data of Exercise 3.8.Obtain the model parameters and test for significance of the model. Using theresiduals of this model, check that the normality assumption is
Using effects coding method to define the dummy variables, obtain the regressionmodel for the data of Exercise 3.8. Estimate the model parameters andtest for significance of the model.
Write a SAS program to analyze the repeated measures data of Exercise 3.5 using the MIXED procedure.
Write a SAS program to analyze the repeated measures data of Exercise 3.3 using the MIXED procedure.
Write a SAS program to analyze the data of Example 3.1 using orthogonal contrasts and the model (4.22).
Write a SAS program to analyze the data of Exercise 3.8 using orthogonal contrasts and the model developed for the data in Exercise 4.7.
For the model fitted for Exercise 4.7, obtain the fitted responses and the residuals. Check that the normality assumption is satisfied.
Write a SAS program to analyze the data under the model of Exercise 4.3.
Repeat Exercise 4.5 for the model defined under Exercise 4.4.
In an experiment to study the effect of two factors, A and B, a two-way layout was used, and the measurements were replicated three times. Analyze the data and compare the means for factor A using Duncan’s multiple range test. Factor B Levels of factor A I II III IV 123 23, 35, 30 27, 19, 15
Write a SAS program to carry out the analysis of Exercise 3.4 using GLM procedure.
Using regression analysis, use SAS to carry out the analysis of the responses of Example 2.2a containing the one-way experimental layout. There are four treatments with n1 observations for treatment 1, n2 observations for treatment 2, . . ., and n4 observations for treatment 4 with the following
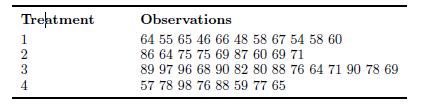
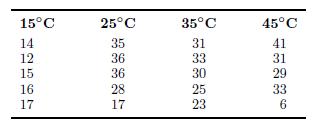
In an experiment to compare the yields of a process under four different temperatures, the following data were obtained: Is there any significant difference in the yield of the process at different temperatures?Using orthogonal polynomials or otherwise, fit a response curve to the data. 15C 25C
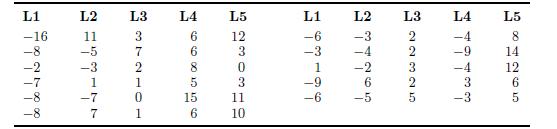
In a production process, five production lines L1–L5 were chosen at random for study; 11 determinations were made for each production line. The differences between the benchmark number of items expected to be produced per unit time and the actual number produced were recorded; the data are
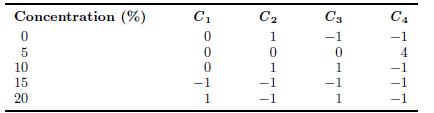
Using the data of Example 2.3, and the following table of contrasts, obtain the linear combinations of treatment totals as well as the sums of squares for the above contrasts and hence perform ANOVA to check which of them is significant. Concentration (%) 0 5 10 15 20 C1 C2 0 0 0 1 1 S10177 C3
Use the theory of regression analysis to carry out the test to show that the fitted parameters in Equation 2.32 for the responses of experiment in Example 2.4 are significant.
Obtain a regression model for data of Exercise 2.4, using the effects coding method for the dummy variables. Analyze the data, fitting the model and testing for significance of the fitted parameters. Extract residuals for this fit and test for the assumption of normality of the errors.
Obtain a regression model for data of Exercise 2.4 using the reference cell coding method for dummy variables. Analyze the data, fitting the model and testing for significance of the fitted parameters. Extract residuals for this fit and test for the assumption of normality of the errors. Use L5 as
Using Bartlett’s test, check whether the variances of the data of Exercise 2.1 are homogenous; repeat the same test using Levene’s modified test. Do both tests reach the same conclusion?
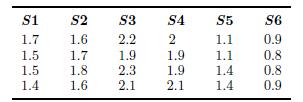
The time of reaction to different stimuli was being studied in a CRD. The reaction times measured in seconds are as follows: Test for significant difference between means of stimuli at 1% significance.Extract residuals and test for normality assumption. Using Levene’s test, check for
Use orthogonal contrasts (Helmert coding) to obtain a regression model for the experiment in Exercise 2.10, estimate its parameters and test for significance of different stimuli.
Use SAS to analyze the data in Exercise 2.10 using orthogonal contrasts.Extract the residuals and use it to carry out diagnostics (check for model assumptions).
Write a SAS program to carry out ANOVA and test for significant difference in mean production for the data of Example 2.4.
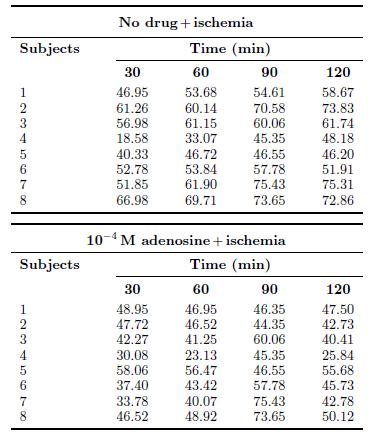
In a study of the action potentials of heart membranes in rabbits when subjected to ischemia, membranes from 16 subjects were used. The first eight were randomly chosen and subjected to ischemia with no drug treatment applied, while the next eight were subjected to ischemia and treated with a
Write a SAS program to use PROC GLM to analyze the data of Exercise 3.1.
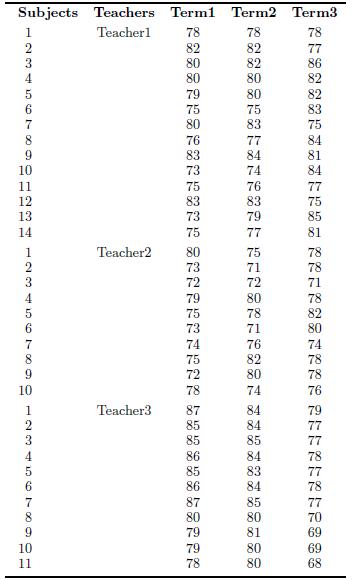
In a study of three teaching methods, three teachers were selected to use the three methods to teach students over three terms. At the end of each term, the students were subjected to the same standard test. The data showing the scores of the students over the period of study are shown as
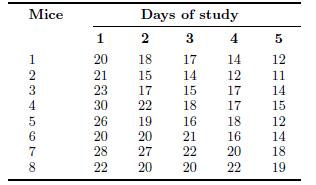
In pharmacokinetics research, eight mice were subjected to equal doses of a drug for five consecutive days. The purpose of the study was to find out whether their ability to absorb the drug diminishes with use. A blood test was used to measure absorption levels. The following data show the
Fit a regression model to the data of Exercise 3.8 using orthogonal contrasts.Perform ANOVA to test for significance of the model. Obtain the fitted valuesand residuals for this design. Obtain a plot of residuals against fitted valuesand comment on its pattern. Obtain a normal probability plot of
Write a SAS program to analyze the repeated measures data of Exercise 3.1using the MIXED procedure.
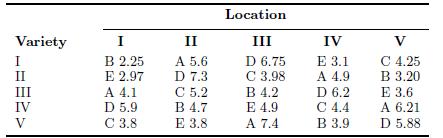
In a farm settlement program on growth of cassava, five varieties of fertilizers were studied. Since the farm settlements were located in different parts of the country, five locations were chosen for the study and five varieties of cassava were also studied. The 5×5 Latin square design was chosen
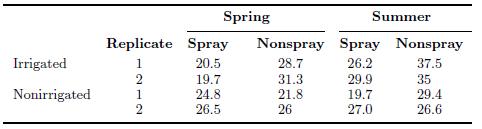
A 23 factorial experiment was carried out on methods of cultivating cauliflower. The factors were 1. Fertilizers applied in spring or summer 2. Spraying or nonspraying 3. Irrigation or lack of irrigation The experiment was performed twice, and the percentage of poor quality cauliflower was observed
In a full 2k factorial experiment for the study of the effects of combinations of three fertilizer types, N, K, and P each at two levels, on the growth of sweet potatoes; the following data show the weights of good sweet potatoes picked for plots of the same size following applications of
The wear index of a metal that is used to make engine blocks is measured under experimental conditions. The wear is affected by the length of time the metal is under stress, the temperature of the metal, and the percentage of the alloy in the metal. Low values of the index indicate little wear. A
It is suspected that the yield of a chemical plant is influenced by five factors:A, temperature; B, pressure; C, operating mode (manual or automatic);D, catalyst concentration; and E, speed. These factors were all set at two levels, and the yields of the plants were studied as 25 factorial
In a similar experiment involving maize of different varieties, it was considered that the spacing of the maize could influence yield, so five spacing methods were studied in addition to five varieties of maize and five locations as well as five fertilizer treatments. A Graeco-Latin square design
At the pilot stages of the steel production program by a National Steel Company, a 3×3 Graeco-Latin square experiment was carried out to compare the tensile strengths of steel rods produced under different carbon treatments.The company sourced its iron ore from three mines at I, O, and M. It has
In an industrial research on extraction of flavoring oils, raw materials were sourced from five different countries and each of was subjected to extraction using vessels of five different sizes, each of which was set at five different extraction temperatures, while five types of chemicals were
In the training of machinists, 16 apprentices were tested on four tasks, which require machine skills. The different skills were tested on different days.A 4×4 Latin square design replicated four times was employed for this study.The Latin letters represent the tests; the rows, the subjects; while
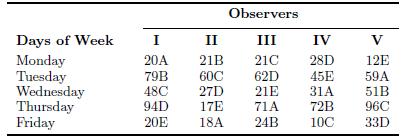
An engineer studying the occurrence of an event in a certain process, which depends on the time of the day, and day of the week, had to use a number of observers to record the incidents. Since the occurrences of the event in 5 days of the week were being studied, five observers and five time
In phytochemical research, the percentage content of a plant chemical extract used for drug production was being studied. It was believed that the contents could vary according to the country of origin of the plant and the plant type from which it is extracted, as well as the method of extraction.
An experimenter wanted to compare the effects of four chemicals A, B, C, and D on water hardness. Hard water from three different locations was used in the study, but the location of hard water was considered a nuisance in the study. RCBD would be used to analyze the data. Analyze the data and test
A company is studying four methods for extracting an important bio-fuel from a plant species. It obtained the plants from four sources (countries)and thought that the source might affect the amount of bio-fuel extracted. It decided to treat the source as block in the study of the extraction
To compare five varieties of wheat, a RCBD with four blocks (plots) was used.Unfortunately, one unit was damaged very badly and the yield from that unit had to be ignored. Estimate the yield from the unit, and hence completely analyze the data stating your conclusions fully. Wheat varieties 4221 2
A randomized block experiment was performed to study six corn varieties, which were grown in four experimental parcels of land in different locations, treated as blocks. The yields are recorded below in hundreds of bushels per acre Analyze the responses fully and report your findings. Carry out
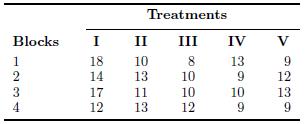
The data below were obtained from a randomized block experiment in which five treatments were being compared in four blocks Carry out a full analysis to compare the treatments. Extract fitted values and residuals and check for normality assumption. Treatments Blocks I II III IV V 1234 18 10 14
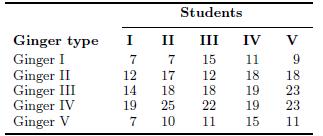
An experiment was performed to compare the quantity of oleoresin derivable from a unit weight of ginger obtained from five countries. Five students with differing skills were given a unit weight of ginger from each of the five countries to determine the oleoresin contents in milligrams. Analyze
Use SAS to carry out the analysis required in Exercise 5.13, assuming fixed effects for both factors.
Use SAS to carry out the analysis of the responses in the experiment in Exercise 5.4.
Use SAS to carry out the analysis of the responses in the experiment in Exercise 5.3.
Use SAS to carry out the analysis of the responses in the experiment in Exercise 5.2.
A 24 experiment was performed in three replicates to study a system. The responses of the design are presented below. Analyze the data and draw conclusions regarding the factors A, B, C, and D. Replicates Treatment combinations 4 Replicates II III Treatment (1) a b ab bc abc combinations I II
Use SAS to carry out the analysis required for Exercise 12.12.
Write a SAS program to carry out the analysis of responses of the experiment in Exercise 12.7.
Write a SAS program to carry out the analysis of responses of the experiment in Exercise 12.2.
Write a SAS program to carry out the analysis of responses of the experiment in Exercise 12.1.
Write a SAS program to carry out the analysis of responses of the experiment in Exercise 12.3.
Write a SAS program to carry out the analysis of the responses of the experiment in Exercise 12.5.
Write a SAS program to analyze the data of Exercise 11.8.
Write a SAS program to analyze the data of Exercise 11.7.
Write a SAS program to analyze the data of Exercise 11.6.
Write a SAS program to analyze the responses of the experiment described in Exercise 10.2.
Write a SAS program to analyze the data of Exercise 10.5, extract residuals, and fitted values, and carry out a normal probability plot of the residuals.
Obtain the estimates of treatment effects in the design of Exercise 10.9 and use LSD method to compare the treatment effects at 1% level of significance.
Write a SAS program to analyze the responses of the experiment described in Exercise 10.9.
Write a SAS program to analyze the responses of the experiment described in Exercise 10.6.
Showing 500 - 600
of 4740
1
2
3
4
5
6
7
8
9
10
11
12
13
14
15
Last
Step by Step Answers