

Question: A process management team has studied a process and has developed the flowchart in Figure 5.16. The team also has determined that the expected waiting
A process management team has studied a process and has developed the flowchart in Figure 5.16. The team also has determined that the expected waiting and processing times (in minutes) corresponding to each activity in the process are as shown in Table 5.17.
a. Calculate the average CT for this process.
b. Calculate the CT efficiency.
TABLE 5.17 Time Data for Exercise 5.15 Activity Waiting Time (Min)
Processing Time (Min)
A 20 12 B 15 18 C 5 30 D 12 17 E 3 12 F 5 25 G 8 7 H 5 10 I 15 25 J 5 20 K 4 10
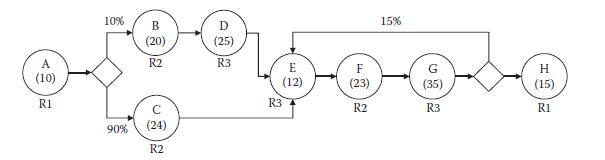
10% 15% B D (20) (25) R2 R3 E F H (10) R1 Lo 90% (24) (12) (23) (35) (15) R3 R2 R3 R1 R2
Step by Step Solution
There are 3 Steps involved in it
1 Expert Approved Answer
Step: 1 Unlock

Question Has Been Solved by an Expert!
Get step-by-step solutions from verified subject matter experts
Step: 2 Unlock
Step: 3 Unlock