

The following table represents the market share (in number of movies, gross in millions of dollars, and
Question:
The following table represents the market share (in number of movies, gross in millions of dollars, and millions of tickets sold) of each type of movie in a recent year: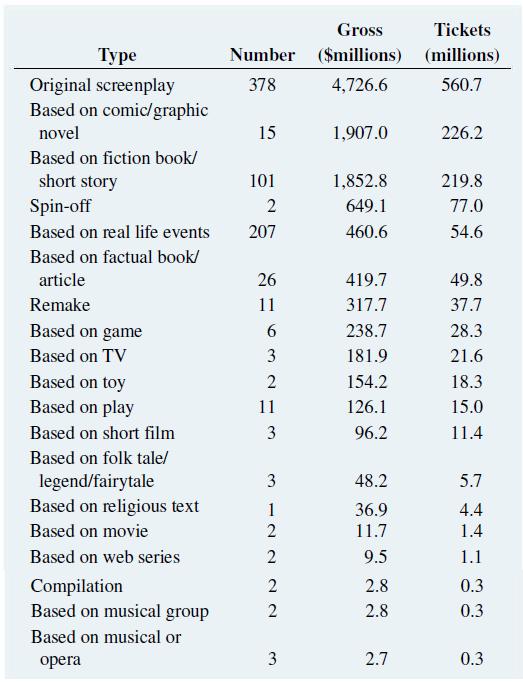
a. Construct a bar chart, a pie chart, a doughnut chart, and a Pareto chart for the number of movies, gross (in $millions), and number of tickets sold (in millions).
b. What conclusions can you reach about the market shares of the different types of movies in 2016?
Fantastic news! We've Found the answer you've been seeking!
Step by Step Answer:
a Number of Movies Gross Tickets Sold b Based on the Pareto chart for the number of movies Original ...View the full answer

Answered By
Shubhradeep Maity
I am an experienced and talented freelance writer passionate about creating high-quality content. I have over five years of experience working in the field and have collaborated with several renowned companies and clients in the SaaS industry.
At Herman LLC, an online collective of writers, I generated 1,000+ views on my content and created journal content for 100+ clients on finance topics. My efforts led to a 60% increase in customer engagement for finance clients through revamping website pages and email interaction.
Previously, at Gerhold, a data management platform using blockchain, I wrote and published over 50 articles on topics such as Business Finance, Scalability, and Financial Security. I managed four writing projects concurrently and increased the average salary per page from $4 to $7 in three months.
In my previous role at Bernier, I created content for 40+ clients within the finance industry, increasing sales by up to 40%.
I am an accomplished writer with a track record of delivering high-quality content on time and within budget. I am dedicated to helping my clients achieve their goals and providing exceptional results.
1+ Reviews
10+ Question Solved
Related Book For 

Business Statistics A First Course
ISBN: 9780135177785
8th Edition
Authors: David M. Levine, Kathryn A. Szabat, David F. Stephan
Question Posted:
