

Question: 13.24 Consider the following graphs of the scatterplot for variable Y versus X, the histogram of the standardized residuals, the residuals versus X plot for
13.24 Consider the following graphs of the scatterplot for variable Y versus X, the histogram of the standardized residuals, the residuals versus X plot for a given set of data X and Y.
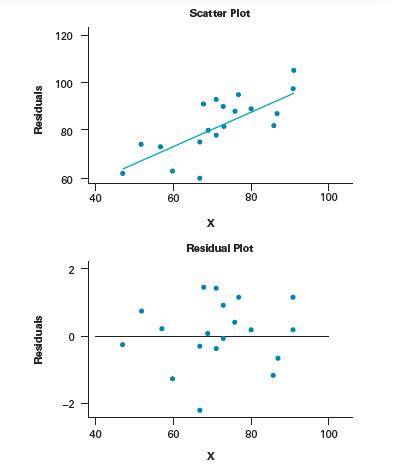
Justify whether each model is appropriate for the given set of data, X and Y, by interpreting each plot.
Residuals Residuals 120 Scatter Plot 100 80 60 2 0 -2 40 60 40 40 60 60 80 100 x Residual Plot 80 100 x
Step by Step Solution
There are 3 Steps involved in it
1 Expert Approved Answer
Step: 1 Unlock

Question Has Been Solved by an Expert!
Get step-by-step solutions from verified subject matter experts
Step: 2 Unlock
Step: 3 Unlock