

Question: 21. The Nielsen Home Technology Report provided information about home technology and its usage. The following data are the hours of personal computer usage during
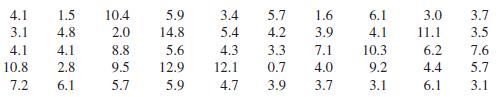
21. The Nielsen Home Technology Report provided information about home technology and its usage. The following data are the hours of personal computer usage during one week for a sample of 50 persons.
Summarize the data by constructing the following:
a. A frequency distribution (use a class width of three hours)
b. A relative frequency distribution
c. A histogram
d. An ogive
e. Comment on what the data indicate about personal computer usage at home.
4.1 1.5 10.4 5.9 3.4 5.7 1.6 6.1 3.0 3.7 3.1 4.8 2.0 14.8 5.4 4.2 3.9 4.1 11.1 3.5 4.1 4.1 8.8 5.6 4.3 3.3 7.1 10.3 6.2 7.6 10.8 2.8 9.5 12.9 12.1 0.7 4.0 9.2 4.4 5.7 7.2 6.1 5.7 5.9 4.7 3.9 3.7 3.1 6.1 3.1
Step by Step Solution
There are 3 Steps involved in it

Get step-by-step solutions from verified subject matter experts