

A researcher conducts a mileage economy test involving 80 cars. The frequency distribution describing average miles per
Question:
A researcher conducts a mileage economy test involving 80 cars. The frequency distribution describing average miles per gallon (mpg) appears in the following table.
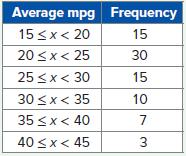
a. Construct the relative frequency distribution. What proportion of the cars got at least 20 mpg but less than 25 mpg? What proportion of the cars got less than 35 mpg? What proportion of the cars got 35 mpg or more?
b. Construct a histogram. Comment on the shape of the distribution.
Fantastic news! We've Found the answer you've been seeking!
Step by Step Answer:
a 0375 of the cars got at least 20 but less tha...View the full answer

Answered By
Nazrin Ziad
I am a post graduate in Zoology with specialization in Entomology.I also have a Bachelor degree in Education.I posess more than 10 years of teaching as well as tutoring experience.I have done a project on histopathological analysis on alcohol treated liver of Albino Mice.
I can deal with every field under Biology from basic to advanced level.I can also guide you for your project works related to biological subjects other than tutoring.You can also seek my help for cracking competitive exams with biology as one of the subjects.
2+ Reviews
10+ Question Solved
Related Book For 

Business Analytics Communicating With Numbers
ISBN: 9781260785005
1st Edition
Authors: Sanjiv Jaggia, Alison Kelly, Kevin Lertwachara, Leida Chen
Question Posted:
