

Question: Develop a predictive model for the price of a house in the college town of Ames, Iowa. Before evaluating various models, you first have to
Develop a predictive model for the price of a house in the college town of Ames, Iowa. Before evaluating various models, you first have to filter out the House Price data to get the appropriate subset of observations for selected variables. After you have obtained the preferred model, summarize your findings as well as predict the price of a house in Ames, Iowa, given typical values of the predictor variables.

Investing in college town real estate can be a smart move. First, students offer a steady stream of rental demand as many cash-strapped public universities are unable to house their students beyond freshman year. Second, this demand is projected to grow. The National Center for Education Statistics predicts that college enrollment in the U.S. will reach 19.8 million students by 2025, an increase of 14% from its 2014 enrollment of 17.3 million. A regression analysis is conducted to determine the factors that influence the sale price of a single-family house in Ames, Iowa—home to Iowa State University. For a sample of 209 single-family houses in 2016, the following data are collected: the house’s sale price (Price in $), the number of bedrooms (Beds), the number of bathrooms (Baths), the square footage (Sqft), and the lot size (L Size in square feet). Table 6.17 shows the mean values of the relevant variables for newer houses (those built in 2000 or after), old houses (those built prior to 2000), and for all houses in the sample. Median values are shown in parentheses.
TABLE 6.17 The Mean (Median) of Variables for New, Old, and All Houses
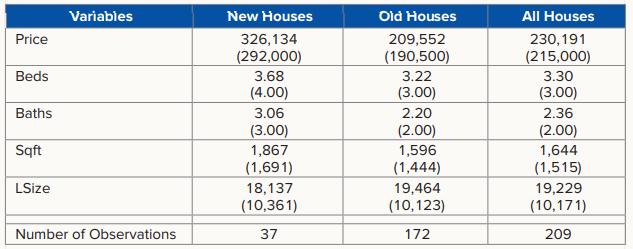
The average sale price for the newer houses is substantially more than that for the older houses. For all houses, given that the mean is higher than the median, the house price distribution is positively skewed, indicating that a few expensive houses have pulled up the mean above the median. The square footage and the lot size are also positively skewed. Finally, relatively newer houses have more bedrooms, bathrooms, and square footage but a smaller lot size. This is consistent with a 2017 article in Building magazine that found that newer houses have become 24% bigger over the past 15 years, while lot sizes have shrunk 16%.
In order to analyze the factors that may influence the price of a house, the following linear regression model with all the referenced predictor variables is considered:
![]()
Where New is a dummy variable that equals 1 if the house was built in 2000 or after, 0 otherwise. It is expected that Beds, Bath, Sqft, and Lsize will have a positive relationship with Price; that is, a house with more bedrooms and bathrooms is expected to obtain a higher price than one with fewer bedrooms and bathrooms. Similarly, a bigger house, or one on a bigger lot, is expected to obtain a higher price. A newer house, one with all the latest updates, is expected to obtain a higher price as compared to an older house in need of work. Column 2 of Table 6.18 shows the regression results from estimating this complete model.
TABLE 6.18 Estimates of Alternative Regression Models to Predict House Price, n = 209
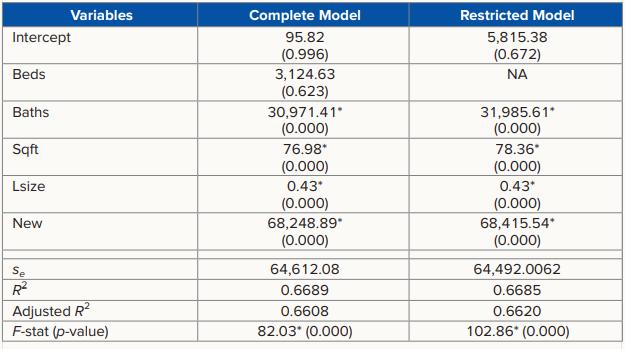
All predictor variables with the exception of Beds are correctly signed and statistically significant. Perhaps the lack of significance of Beds is due to multicollinearity because the number of bedrooms is likely to be correlated with the number of bathrooms as well as square footage. An alternative explanation might be that additional bedrooms add value only in houses with large square footage. For comparison, a restricted model is estimated that omits Beds from the list of predictor variables; see Column 3 of Table 6.18 for the results. The following observations are made:
The restricted model is preferred because it has the lower standard error of the estimate se and the higher adjusted R2.
- Holding other factors constant, an additional bathroom adds about $31,986 in value. Similarly, a 100-square-foot increase in a house adds $7,836 in value and a 1,000-square-foot increase in the lot size adds $430 in value. Finally, there is a premium of $68,416 for relatively newer houses.
- The coefficient of determination reveals that 66.85% of the variability in sale price is explained by the predictor variables, implying that approximately 33.15% is unexplained. This is not surprising because other factors, such as the condition of the house or its proximity to nearby amenities, are likely to influence the sales price.
- Suppose a 1,600-square-foot house with two bathrooms sits on a 15,000-square-foot lot. Given the preferred model, its predicted sale price is $269,969 for a relatively newer house and $201,553 for an older house.
Step by Step Solution
3.52 Rating (165 Votes )
There are 3 Steps involved in it
From the information provided and the regression results given in the tables we can summarize the findings and predict the price of a house in Ames Io... View full answer

Get step-by-step solutions from verified subject matter experts