

Leading economic indicators, such as the stock market or the housing market, often change prior to large
Question:
Leading economic indicators, such as the stock market or the housing market, often change prior to large economic adjustments. For example, a rise in stock prices often means that investors are more confident of future growth in the economy. Or, a fall in building permits is likely a signal that the housing market is weakening – which is often a sign that other sectors of the economy are on the downturn.
Consider what happened prior to the 2008 recession. As early as October 2006, building permits for new homes were down 28% from October 2005. Analysts use economic indicators to predict future trends and gauge where the economy is heading. The information provided by economic indicators helps firms implement or alter business strategies.
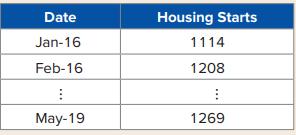
Pooja Nanda is an analyst for a large investment firm in Chicago. She covers the construction industry and has been given the challenging task of forecasting housing starts for June 2019. She has access to seasonally adjusted monthly housing starts in the United States from January 2016 to May 2019. A portion of the data is shown in Table 12.19.
TABLE 12.19 Monthly Housing Starts (in 1,000s)
Pooja would like to use the sample information to identify the best-fitting model to forecast housing starts for June 2019. Leading economic indicators are often used to gauge where the economy is heading. The housing market is one of the most important indicators because it is a significant component of the economy. When this sector weakens, just about everyone and everything feels it – from homeowners and construction workers to government municipalities that rely on property taxes to operate. Given the importance of the housing market, this report will forecast next month’s housing starts using historical data.
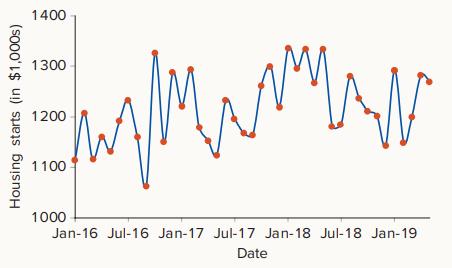
A scatterplot of housing starts from January 2016 to May 2019 is shown in Figure 12.9. A casual observation of the scatterplot suggests quite a bit of random variation and possibly a slight upward trend. There is no concern for seasonality as the housing starts data represent seasonally adjusted annual rates.
FIGURE 12.9 Scatterplot of housing starts (in 1,000s)
Given the findings from Figure 12.9, three trend models are estimated.
1. The three-period moving average model.
2. The simple exponential smoothed model with various values for the speed of decline α.
3. The simple linear trend model, yt = β0 + β1Timet + εt, where yt represents housing starts.
Three performance measures are used for model selection: mean square error (MSE), mean absolute deviation (MAD), and the mean absolute percentage error (MAPE). The preferred model will have the lowest MSE, MAD, or MAPE. Table 12.20 shows the values of these three performance measures for the models.
Table 12.20 Performance Measures of Competing Models
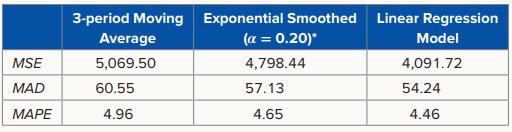
*For the exponential smoothing model, α = 02 provides the lowest values for MSE, MAD, and MAPE
The linear trend model provides the best sample fit, as it has the lowest values for MSE, MAD, and MAPE. Therefore, the estimated linear trend model is used to derive the forecast for June 2019 as
ŷ42 = 1,170.2524 + 2.1413 × 42 = 1,260.19.
Housing starts plays a key role in determining the health of the economy and is, therefore, always under scrutiny. The U.S. housing market seems to be on solid ground even though there has been slowdown from its peak in early 2018. In this report, we employ simple time series models to project historical data on housing starts.
Step by Step Answer:
Based on the information presented Pooja Nanda has access to seasonally adjusted monthly housing starts data from January 2016 to May 2019 in order to ...View the full answer


Business Analytics Communicating With Numbers
ISBN: 9781260785005
1st Edition
Authors: Sanjiv Jaggia, Alison Kelly, Kevin Lertwachara, Leida Chen
