

The accompanying table shows a portion of midterm and final grades for 32 students. Construct a scatterplot
Question:
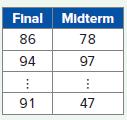
The accompanying table shows a portion of midterm and final grades for 32 students. Construct a scatterplot of Final against Midterm. Describe the relationship.
Fantastic news! We've Found the answer you've been seeking!
Step by Step Answer:
There appears to be a positive re...View the full answer

Answered By
Jehal Shah
I believe everyone should try to be strong at logic and have good reading habit. Because If you possess these two skills, no matter what difficult situation is, you will definitely find a perfect solution out of it. While logical ability gives you to understand complex problems and concepts quite easily, reading habit gives you an open mind and holistic approach to see much bigger picture.
So guys, I always try to explain any concept keeping these two points in my mind. So that you will never forget any more importantly get bored.
Last but not the least, I am finance enthusiast. Big fan of Warren buffet for long term focus investing approach. On the same side derivatives is the segment I possess expertise.
If you have any finacne related doubt, do reach me out.
1+ Reviews
10+ Question Solved
Related Book For 

Business Analytics Communicating With Numbers
ISBN: 9781260785005
1st Edition
Authors: Sanjiv Jaggia, Alison Kelly, Kevin Lertwachara, Leida Chen
Question Posted:
