

Question: 4.29 Used Car Market (Example 3) Assume that the scatterplot shows the median volume and median value of used cars over the years in the
4.29╇ Used Car Market (Example 3)╇ Assume that the scatterplot shows the median volume and median value of used cars over the years in the UK used car market.
a. As the data are graphed, which is the independent and which is the dependent variable?
b. Why do you suppose median value and volume have been used instead of the mean?
c. Using the graph, estimate the median value of sales if the median volume of used cars sold is 2.3 million.
d. Use the equation to predict the median value of sales if the median volume of used cars sold is 2.3 million.
e. What other factors besides the price of used cars might influence the volume of used cars sold?
0
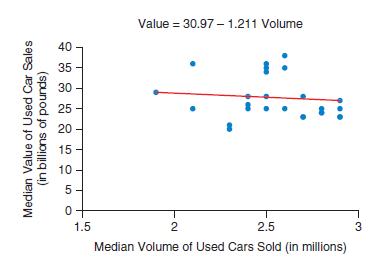
Median Value of Used Car Sales (in billions of pounds) 40 35 30- 25 20- 15 10- 5 0 1.5 Value = 30.97-1.211 Volume 2 2.5 Median Volume of Used Cars Sold (in millions) 3
Step by Step Solution
There are 3 Steps involved in it

Get step-by-step solutions from verified subject matter experts