

Question: Consider the following data set: a. Construct a frequency distribution using classes of -1 0 up to 0,0 up to 10, etc. How many of
Consider the following data set:
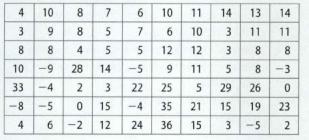
a. Construct a frequency distribution using classes of -1 0 up to 0,0 up to 10, etc. How many of the observations are at least 10 but less than 20?
b. Construct a relative frequency distribution and a cumulative relative frequency distribution. What percent of the observations are at least 10 but less than 20? What percent of the observations are less than 20?
c. Graph a relative frequency polygon. Is the distribution symmetric? If not, then how is it skewed? R-69
4 10 8 7 6 10 11 14 13 14 3 9 8 5 7 6 10 8 8 4 5 5 12 12 10 -9 28 14 -5 9 11 5 33 -4 2 3 22 25 5 -8-5 0 15 -4 35 21 4 6-2 12 24 36 15 335253 11 11 8 8-3 26 0 m 8 19 23 -5 2
Step by Step Solution
There are 3 Steps involved in it

Get step-by-step solutions from verified subject matter experts