

Question: 1 Consider the following data set: 4 points 6 6 1 6 127 7 -9 34 -3 -6 -3 8 7 8 7 4 27
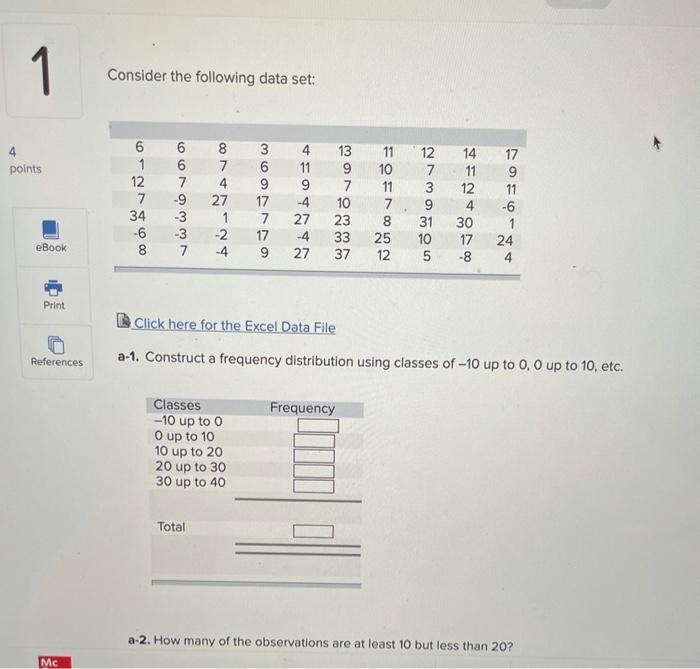
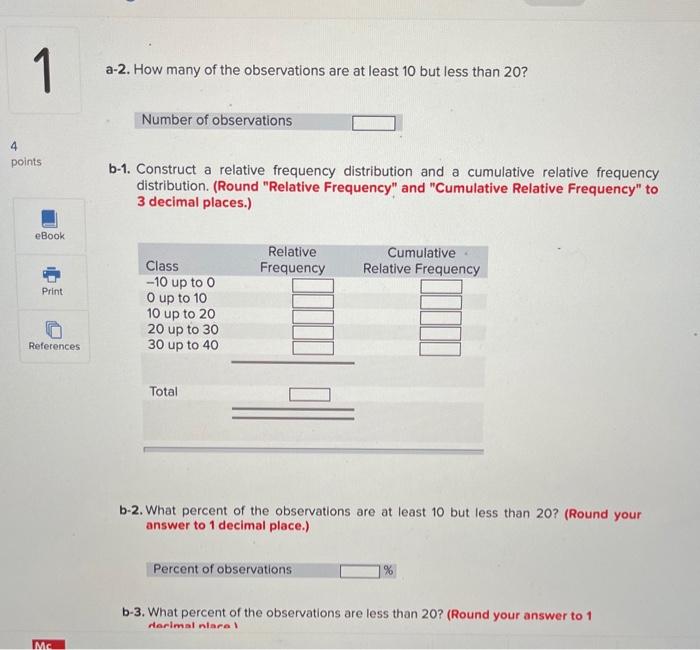
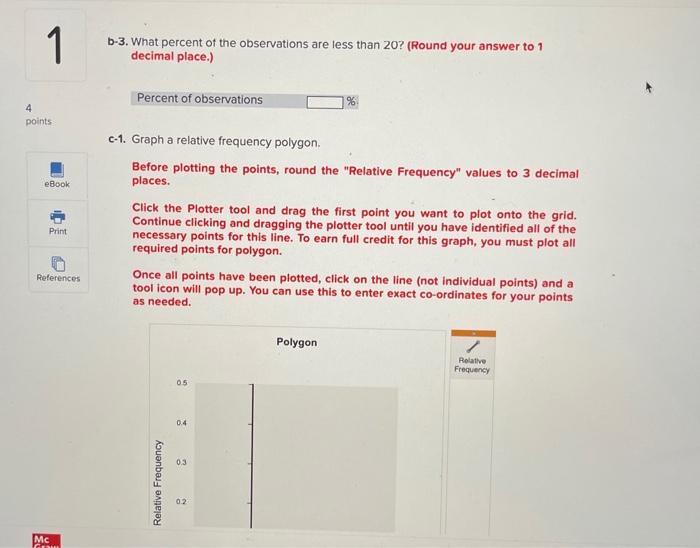
1 Consider the following data set: 4 points 6 6 1 6 127 7 -9 34 -3 -6 -3 8 7 8 7 4 27 1 -2 -4 3 6 9 17 7 17 9 4 13 11 12 14 11 9 10 7 11 97 11 3 12 -4 10 794 27 23 8 31 30 -4 33 25 10 17 27 37 12 5-8 17 9 11 -6 eBook 24 4 Print Click here for the Excel Data File References a-1. Construct a frequency distribution using classes of -10 up to 0. O up to 10, etc. Frequency Classes -10 up to o O up to 10 10 up to 20 20 up to 30 30 up to 40 Total a-2. How many of the observations are at least 10 but less than 20? Mc 1 a-2. How many of the observations are at least 10 but less than 20? Number of observations 4 points b-1. Construct a relative frequency distribution and a cumulative relative frequency distribution. (Round "Relative Frequency" and "Cumulative Relative Frequency" to 3 decimal places.) eBook Relative Frequency Cumulative Relative Frequency Print Class -10 up to 0 O up to 10 10 up to 20 20 up to 30 30 up to 40 References Total b-2. What percent of the observations are at least 10 but less than 20? (Round your answer to 1 decimal place.) Percent of observations b-3. What percent of the observations are less than 20? (Round your answer to 1 Horimal narol MC 1 b-3. What percent of the observations are less than 20? (Round your answer to 1 decimal place.) Percent of observations 4 points eBook c-1. Graph a relative frequency polygon. Before plotting the points, round the "Relative Frequency" values to 3 decimal places. Click the Plotter tool and drag the first point you want to plot onto the grid. Continue clicking and dragging the plotter tool until you have identified all of the necessary points for this line. To earn full credit for this graph, you must plot all required points for polygon. Once all points have been plotted, click on the line (not individual points) and a tool icon will pop up. You can use this to enter exact co-ordinates for your points as needed. Print References Polygon Relative Frequency 05 0.4 0.3 Relative Frequency 0.2 Mc
Step by Step Solution
There are 3 Steps involved in it

Get step-by-step solutions from verified subject matter experts