

The accompanying table shows a portion of the annual return (in %) for the Fidelity Select Technology
Question:
The accompanying table shows a portion of the annual return (in %) for the Fidelity Select Technology Fund and Fidelity Select Energy Fund from 2000 through 2016.
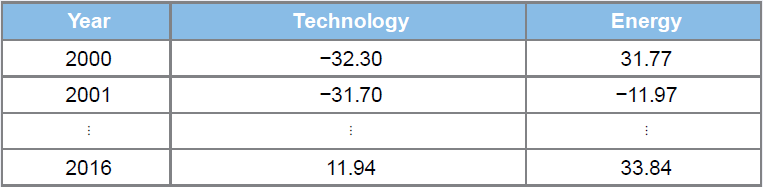
a. Compare the sample means and the sample standard deviations of the two funds.
b. Use a risk-free rate of 2% to compare the Sharpe ratios of the two funds.
Fantastic news! We've Found the answer you've been seeking!
Step by Step Answer:
a The Fidelity Select Energy Fund has a higher mean annual return and a lower sa...View the full answer

Answered By
Alex Maina Muigai
I am a recent graduate of Maseno University, where I earned a Bachelor of Science degree in Chemical Engineering. During my studies, I developed a strong knowledge base in chemical engineering principles, including chemical reaction engineering, fluid mechanics, and thermodynamics. I also gained extensive experience in laboratory techniques and process engineering.
Since graduating, I have been working as a tutor in the field of chemical engineering. I have been providing guidance and support to students in the topics of chemical engineering, including designing chemical processes, designing experiments, and troubleshooting problems. I am also proficient in mathematics, physics, and chemistry, which I use to help my students understand the concepts of chemical engineering.
I have a passion for teaching and helping others understand complex concepts. I have a strong commitment to always providing accurate and reliable information to my students, and I strive to ensure that they have a positive learning experience. I am confident that my knowledge and experience in chemical engineering will be an asset to any student who chooses to work with me.
0 Reviews
10+ Question Solved
Related Book For 
Business Statistics Communicating With Numbers
ISBN: 9781259957611
3rd Edition
Authors: Sanjiv Jaggia
Question Posted:
