

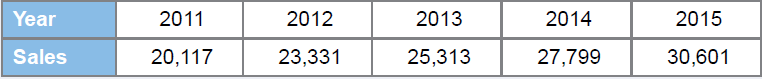
The following table shows sales for Nike (in $ millions) for the years 2011 through 2015. a.
Question:
The following table shows sales for Nike (in $ millions) for the years 2011 through 2015.
a. Use the growth rates for 2011–2012, 2012–2013, 2013–2014, and 2014–2015 to calculate the average growth rate.
b. Calculate the average growth rate directly from sales.
Fantastic news! We've Found the answer you've been seeking!
Step by Step Answer:
a b Ge 410...View the full answer

Answered By
Sumit kumar
I am an experienced online essay writer with a thorough understanding of any curriculum.and subject expert at Chegg for mathematics, CS subjects..
5+ Reviews
13+ Question Solved
Related Book For 

Business Statistics Communicating With Numbers
ISBN: 9781259957611
3rd Edition
Authors: Sanjiv Jaggia
Question Posted:
