

Question: Energy use, part 2. Examine the regression and scatterplot showing the regression line, 95% confidence interval, and 95% prediction interval using 1990 and 2004 energy
Energy use, part 2.
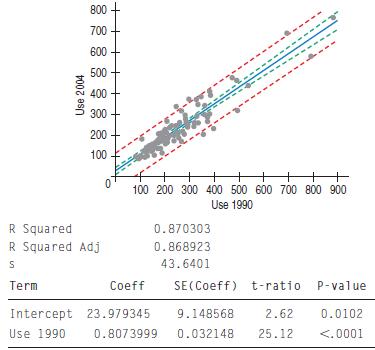
Examine the regression and scatterplot showing the regression line, 95% confidence interval, and 95% prediction interval using 1990 and 2004 energy use
(kg oil equivalent per $1000 GDP) for a sample of 96 countries.
The response variable is 2004 Energy Use.
a) Explain the meaning of the 95% prediction interval in this context.
b) Explain the meaning of the 95% confidence interval in this context.
Use 2004 800 700 600 500 400 300 200 100 0 100 200 300 400 500 600 700 800 900 + Use 1990 R Squared 0.870303 R Squared Adj 0.868923 S 43.6401 Term Coeff SE(Coeff) t-ratio P-value Intercept 23.979345 9.148568 2.62 0.0102 Use 1990 0.8073999 0.032148 25.12
Step by Step Solution
There are 3 Steps involved in it

Get step-by-step solutions from verified subject matter experts