

Shown here are the sales data (in $ millions) for U.S. furniture and home furnishing stores from
Question:
Shown here are the sales data (in $ millions) for U.S. furniture and home furnishing stores from 2012 through 2016 supplied by the U.S. Census Bureau. Using this data:
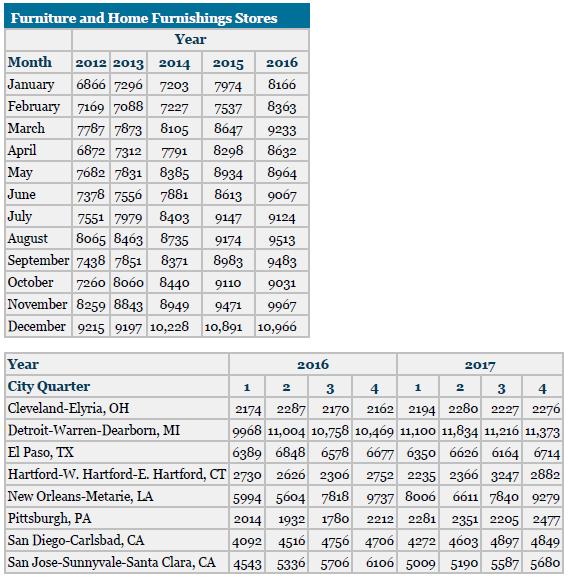
a. Construct a time-series graph of one year of these data. Looking at your graph, what are some of your insights and conclusions regarding this industry in that year?
b. Construct one graph that displays each of the five years’ data separately but in the same graph so that you can compare the five years. See Demonstration Problem 2.4.) What insights and/or conclusions might you reach about this industry now that you can see the five years in one graph?
c. Place the data together in order (perhaps one long column) and construct one graph (similar to part a) with all the data. Seeing one graph of all 60 data points lined up, what insights and understands can you gain that perhaps you didn’t see in part b?
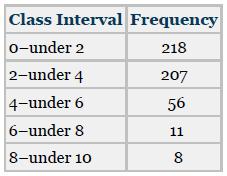
Problem 2.4
The human resources manager for a large company commissions a study in which the employment records of 500 company employees are examined for absenteeism during the past year. The business analyst conducting the study organizes the data into a frequency distribution to assist the human resources manager in analyzing the data. The frequency distribution is shown. For each class of the frequency distribution, determine the class midpoint, the relative frequency, and the cumulative frequency.
Step by Step Answer:
a This timeseries plot for the year 2012 shows up and down swings of sales until October with sa...View the full answer


Business Statistics For Contemporary Decision Making
ISBN: 9781119607458
10th Edition
Authors: Ken Black
