

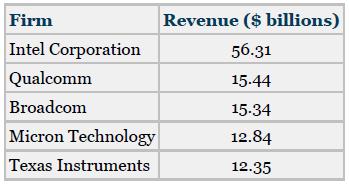
Shown here is a list published by Electronics Weekly.com of the top five semiconductor companies in the
Question:
Shown here is a list published by Electronics Weekly.com of the top five semiconductor companies in the United States by revenue ($ billions).
a. Construct a bar chart to display these data.
b. Construct a pie chart from these data and label the slices with the appropriate percentages.
c. Comment on the effectiveness of using a pie chart versus a bar chart to display the revenue of these five companies.
Fantastic news! We've Found the answer you've been seeking!
Step by Step Answer:
a Bar Graph b Pie Chart c While pie charts are sometimes interest...View the full answer

Answered By
Isaiah Mutinda
As a graduate with Bs in Maths and Computer Science and having worked as a freelance full stack software developer for 3 years running I believe I have what it takes to conformable tutor and mentor a student to a professional developer also.
2+ Reviews
10+ Question Solved
Related Book For 

Business Statistics For Contemporary Decision Making
ISBN: 9781119607458
10th Edition
Authors: Ken Black
Question Posted:
