

Question: The hypothetical data below are from a toxicity study designed to measure the effectiveness of different doses of a pesticide on mosquitoes. The table below
The hypothetical data below are from a toxicity study designed to measure the effectiveness of different doses of a pesticide on mosquitoes. The table below summarizes the concentration of the pesticide, the sample sizes, and the number of critters dispatched.
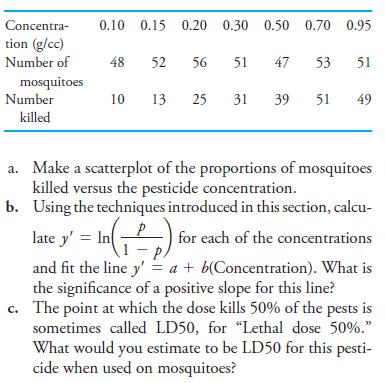
Concentra- 0.10 0.15 0.20 0.30 0.50 0.70 0.95 tion (g/cc) Number of 48 52 56 51 47 53 51 mosquitoes Number 10 13 25 31 39 51 49 killed a. Make a scatterplot of the proportions of mosquitoes killed versus the pesticide concentration. b. Using the techniques introduced in this section, calcu- late y' = In( PA for each of the concentrations and fit the line y' = a + b(Concentration). What is the significance of a positive slope for this line? c. The point at which the dose kills 50% of the pests is sometimes called LD50, for "Lethal dose 50%." What would you estimate to be LD50 for this pesti- cide when used on mosquitoes?
Step by Step Solution
There are 3 Steps involved in it

Get step-by-step solutions from verified subject matter experts