

Question: The hypothetical data below are from a toxicity study designed to measure the effectiveness of different doses of a pesticide on mosquitoes. The table below
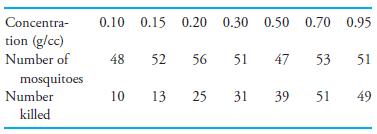
The hypothetical data below are from a toxicity study designed to measure the effectiveness of different doses of a pesticide on mosquitoes. The table below summarizes the concentration of the pesticide, the sample sizes, and the number of critters dispatched.
a. Make a scatterplot of the proportions of mosquitoes killed versus the pesticide concentration.
b. Using the techniques introduced in this section, calculate 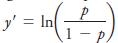 for each of the concentrations and fit the line y =a + b(Concentration). What is the sig nifi cance of a positive slope for this line?
c. The point at which the dose kills 50% of the pests is sometimes called LD50, for “Lethal dose 50%.” What would you estimate to be LD50 for this pesticide when used on mosquitoes?
Concentr 0.10 0.15 0.20 0.30 0.50 0.70 0.95 tion (g/cc) Number of 48 52 56 51 4753 51 mosquitoes Number 10 3 25 31 39 51 49 killed
Step by Step Solution
3.44 Rating (147 Votes )
There are 3 Steps involved in it
a b The leastsquares line relating yand xwhere xis the concent... View full answer

Get step-by-step solutions from verified subject matter experts
Document Format (1 attachment)
536-M-S-D-A (4243).docx
120 KBs Word File