

The U.S. Department of Labor publishes consumer price indexes (CPIs) on many commodities. Following are the percentage
Question:
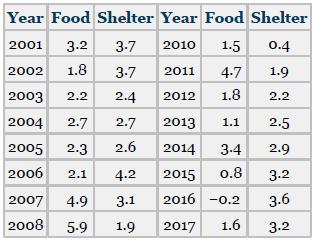
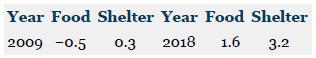
The U.S. Department of Labor publishes consumer price indexes (CPIs) on many commodities. Following are the percentage changes in the CPIs for food and for shelter for the years 2001 through 2018. Use these data to develop a linear regression model to forecast the percentage change in food CPIs by the percentage change in shelter CPIs. Compute a Durbin-Watson statistic to determine whether significant autocorrelation is present in the model. Let α = .05.
Fantastic news! We've Found the answer you've been seeking!
Step by Step Answer:
D 90240974739985 190 Critical values of D Using 1 independent variable n 18 and 05 d L 120 and d U 1...View the full answer

Answered By
Muhammad Umair
I have done job as Embedded System Engineer for just four months but after it i have decided to open my own lab and to work on projects that i can launch my own product in market. I work on different softwares like Proteus, Mikroc to program Embedded Systems. My basic work is on Embedded Systems. I have skills in Autocad, Proteus, C++, C programming and i love to share these skills to other to enhance my knowledge too.
1+ Reviews
10+ Question Solved
Related Book For 

Business Statistics For Contemporary Decision Making
ISBN: 9781119607458
10th Edition
Authors: Ken Black
Question Posted:
