

Question: A scatterplot and a least-squares regression line are shown in the figure below. What effect does point P have on the slope of the regression
A scatterplot and a least-squares regression line are shown in the figure below. What effect does point P have on the slope of the regression line and the correlation?
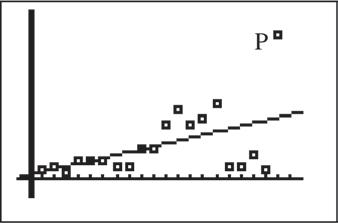
(a) Point P increases the slope and increases the correlation.
(b) Point P increases the slope and decreases the correlation.
(c) Point P decreases the slope and decreases the correlation.
(d) Point P decreases the slope and increases the correlation.
(e) No conclusion can be drawn because the other coordinates are unknown.
Step by Step Solution
There are 3 Steps involved in it
1 Expert Approved Answer
Step: 1 Unlock

Question Has Been Solved by an Expert!
Get step-by-step solutions from verified subject matter experts
Step: 2 Unlock
Step: 3 Unlock