

Question: Computer use Mrs. Causey asked her students how much time they had spent using a computer during the previous week. The following figure shows a
Computer use Mrs. Causey asked her students how much time they had spent using a computer during the previous week. The following figure shows a cumulative relative frequency graph of her students’ responses.
(a) At what percentile does a student who used her computer for 7 hours last week fall?
(b) Estimate the interquartile range (IQR) from the graph. Show your work.
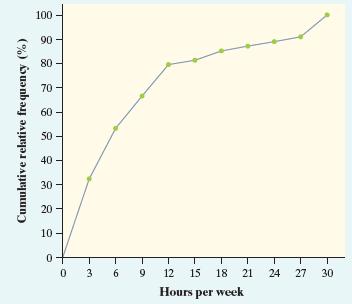
100 90 80 70 Cumulative relative frequency (%) 60 50 40 30 20 10 0 0 3 6 9 12 15 18 21 24 27 30 Hours per week
Step by Step Solution
There are 3 Steps involved in it
1 Expert Approved Answer
Step: 1 Unlock

Question Has Been Solved by an Expert!
Get step-by-step solutions from verified subject matter experts
Step: 2 Unlock
Step: 3 Unlock