

Question: Task 2: Mrs. Causey asked her students how much time 100 they had spent using a computer during the previous week. The following gure shows
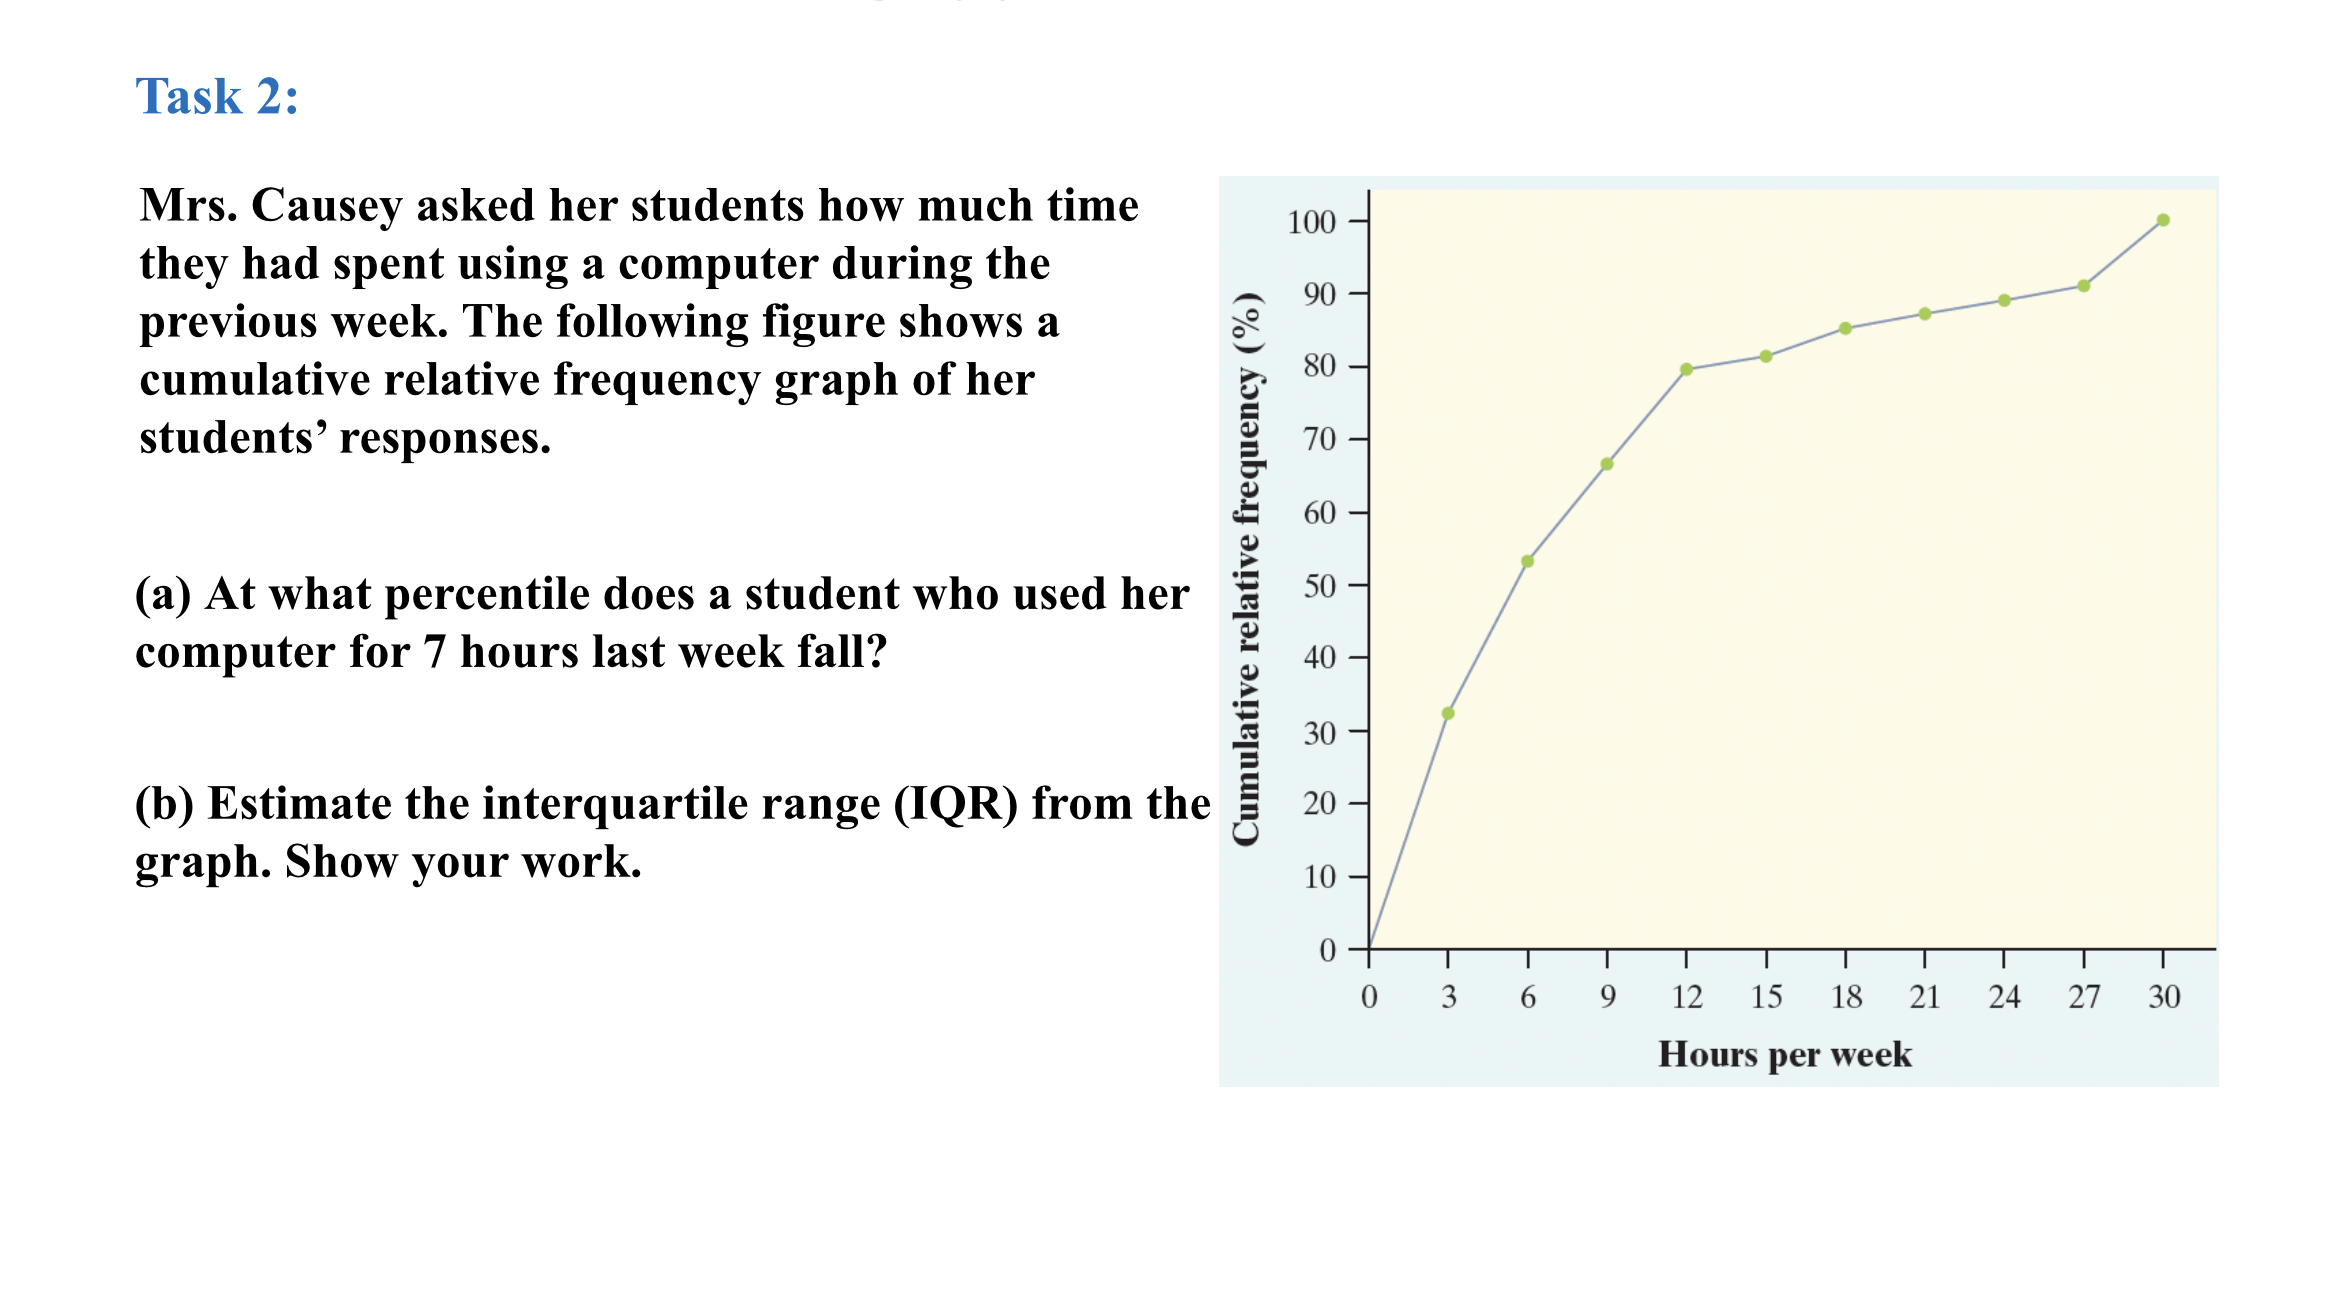


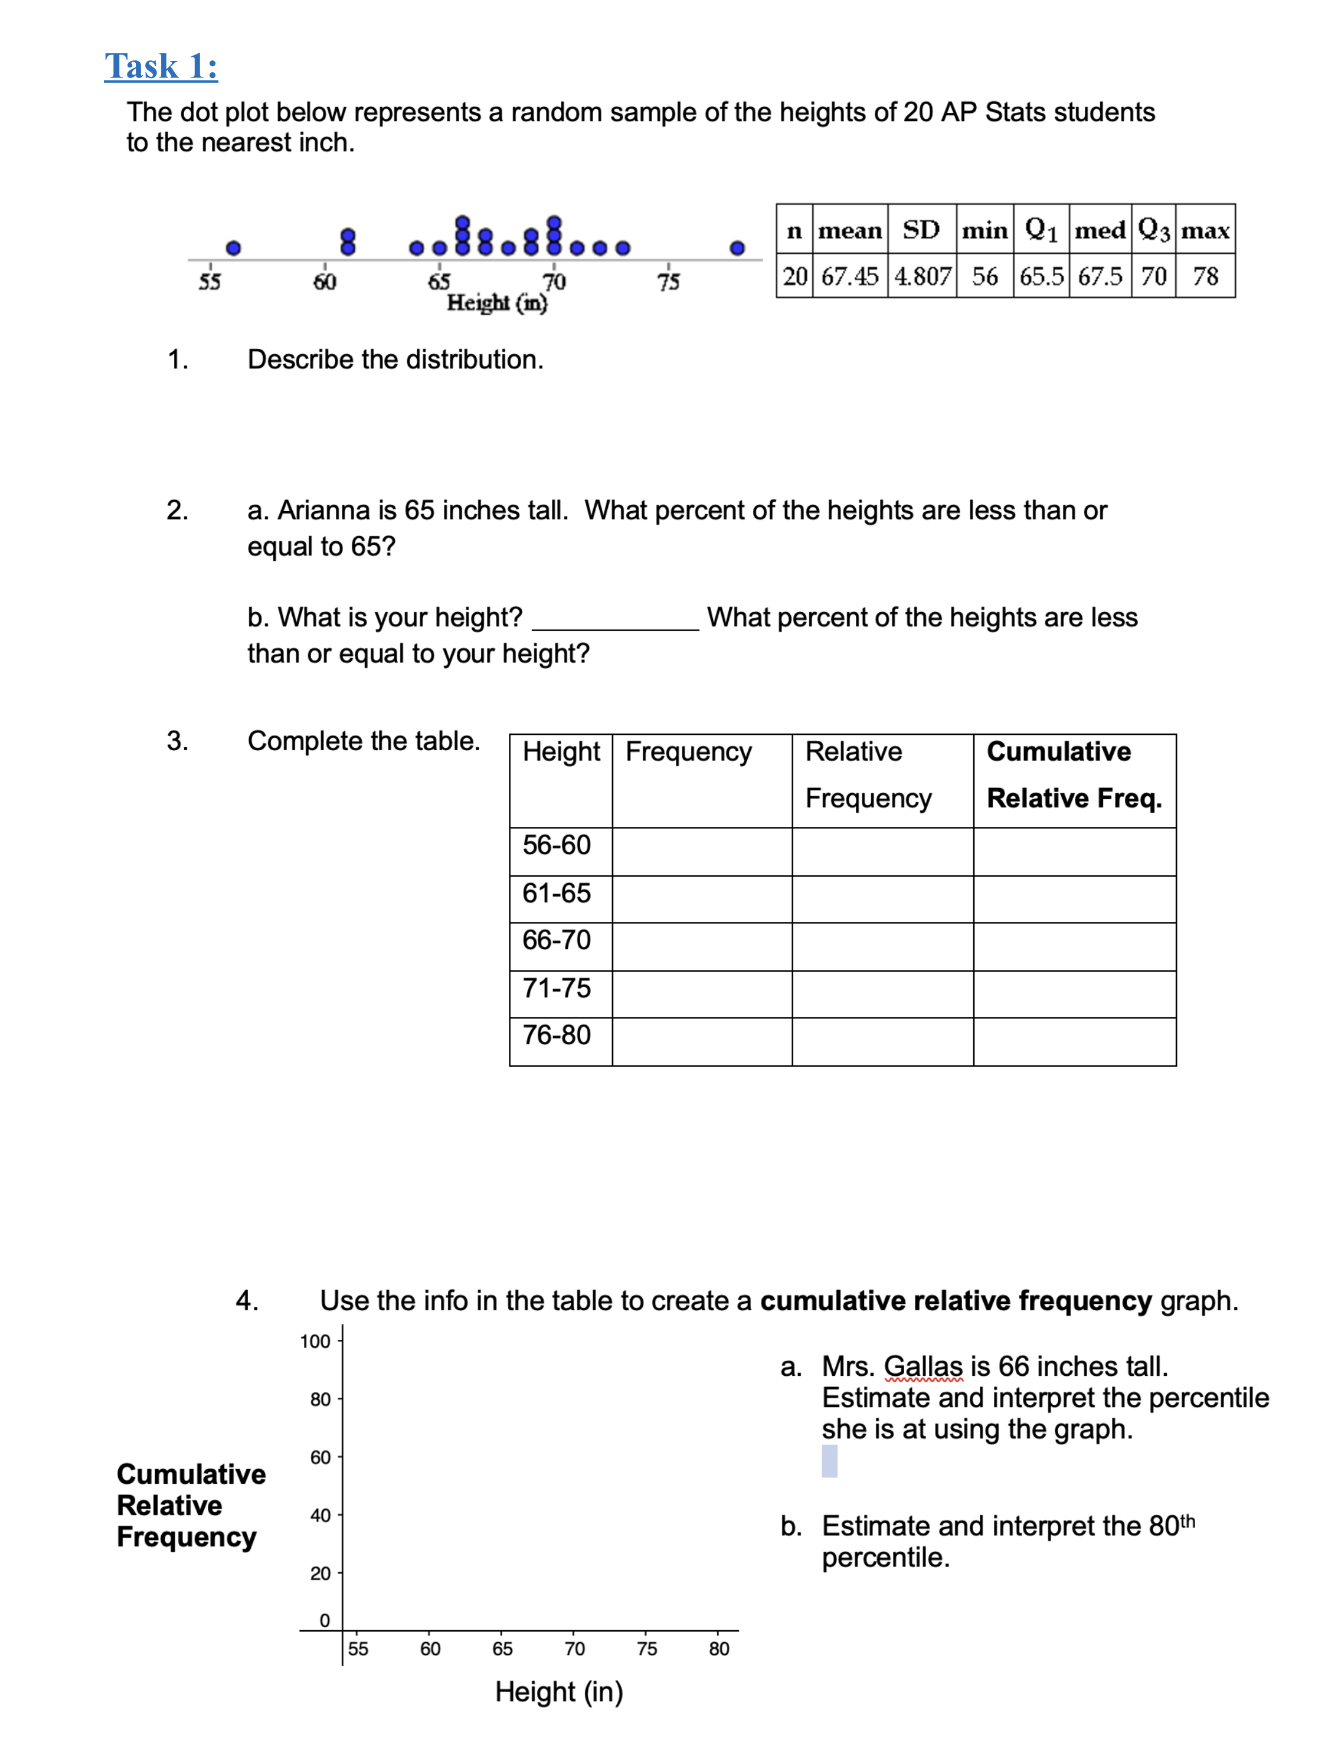
Task 2: Mrs. Causey asked her students how much time 100 they had spent using a computer during the previous week. The following gure shows a cumulative relative frequency graph of her students' responses. 90 so 70 60 (a) At what percentile does a student who used her 50 computer for 7 hours last week fall? 40 Cumulative relative frequency ("/o) (b) Estimate the interquartile range (IQR) from the graph. Show your work. 10 0 3 6 9 12 15 18 21 24 27 30 Hours per week Task 1: The dot plot below represents a random sample of the heights of 20 AP Stats students to the nearest inch. 0 I oe'308!oeo o M-IMM 55 50 55 70 75 20 67.45 4.807 56 65.5 67.5 70 78 Height (in) 1. Describe the distribution. 2. a. Arianna is 65 inches tall. What percent of the heights are less than or equal to 65? b. What is your height? What percent of the heights are less than or equal to your height? 3' Complete the table. Height Frequency Relative Cumulative Frequency Relative Freq. 5660 61 -65 71-75 76-80 4. Use the info in the table to create a cumulative relative frequency graph. 100 - a. Mrs. Gallas is 66 inches tall. so - Estimate and interpret the percentile she is at using the graph. _ 60 - Cumulative Relative _ . . Frequency 4 b. Estimate and Interpret the 80th 20 _ percentile. 55 so 65 7o 75 50 Height (in)
Step by Step Solution
There are 3 Steps involved in it

Get step-by-step solutions from verified subject matter experts