

Question: Study the p chart for a manufactured item. The chart represents the results of testing 30 items at a time for compliance. Sixty different samples
Study the p chart for a manufactured item. The chart represents the results of testing 30 items at a time for compliance. Sixty different samples were taken for this chart. Discuss the results and the implications for the production process.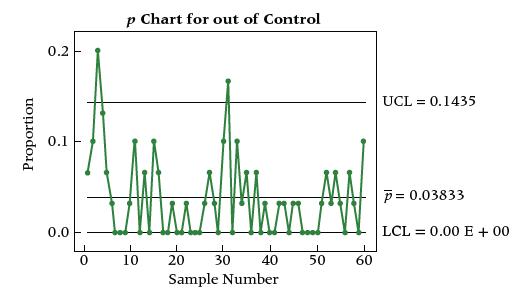
Proportion 0.2 0.1 0.0 0 p Chart for out of Control I 10 M MN I L 20 30 40 Sample Number 50 60 UCL = 0.1435 P = 0.03833 LCL = 0.00 E + 00
Step by Step Solution
★★★★★
3.38 Rating (164 Votes )
There are 3 Steps involved in it
1 Expert Approved Answer
Step: 1 Unlock

The following list provides summary of the control chart abnormalities that sho... View full answer
Question Has Been Solved by an Expert!
Get step-by-step solutions from verified subject matter experts
Step: 2 Unlock
Step: 3 Unlock