

Question: Study the c chart for nonconformances for a part produced in a manufacturing process. Comment on the results. Sample Count 3 N 0 0 1
Study the c chart for nonconformances for a part produced in a manufacturing process. Comment on the results.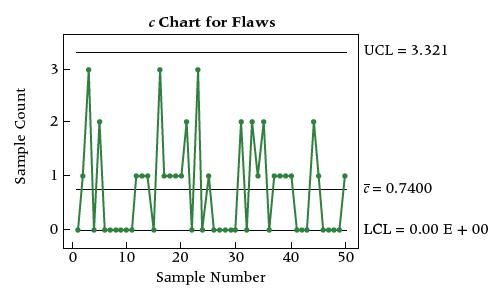
Sample Count 3 N 0 0 1 10 c Chart for Flaws 20 30 Sample Number 40 50 UCL = 3.321 T = 0.7400 LCL = 0.00 E + 00
Step by Step Solution
★★★★★
3.45 Rating (171 Votes )
There are 3 Steps involved in it
1 Expert Approved Answer
Step: 1 Unlock

The c chart is a control chart used for monitoring the count of nonconformities in a sample of items ... View full answer
Question Has Been Solved by an Expert!
Get step-by-step solutions from verified subject matter experts
Step: 2 Unlock
Step: 3 Unlock