

Question: Study the R chart for the product and data used in Problem 18.24. Comment on the state of the production process for this item. Data
Study the R chart for the product and data used in Problem 18.24. Comment on the state of the production process for this item.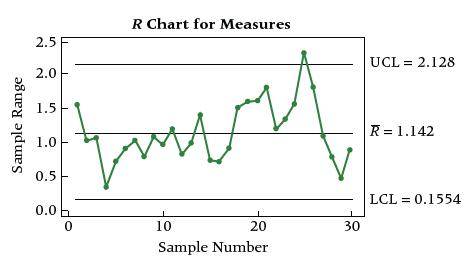
Data from problem 18.24
Study the chart on the size of a product that is supposed to measure 12 cm. Does the process appear to be out of control? Why or why not?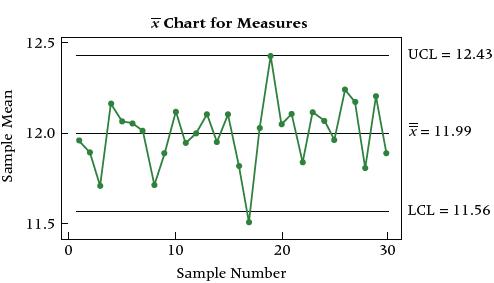
Sample Range 2.5 F 2.0 1.5 V qut 1.0 0.5 0.0 R Chart for Measures 0 10 20 Sample Number 30 UCL = 2.128 R = 1.142 LCL = 0.1554
Step by Step Solution
3.39 Rating (158 Votes )
There are 3 Steps involved in it
The following list provides summary of the control chart ... View full answer

Get step-by-step solutions from verified subject matter experts