

The file BostonHousing.xls contains information on over 500 census tracts in Boston, where for each tract multiple
Question:
The file BostonHousing.xls contains information on over 500 census tracts in Boston, where for each tract multiple variables are recorded. The last column (CAT.MEDV) was derived from MEDV, such that it obtains the value 1 if MEDV>30 and 0 otherwise. Consider the goal of predicting the median value (MEDV) of a tract, given the information in the first 12 columns.
Partition the data into training \(60%\) and validation ( \(40 \%\) ) sets.
a. Perform a \(k\)-NN prediction with all 12 predictors (ignore the CAT.MEDV column), trying values of \(k\) from 1 to 5 . Make sure to normalize the data (click "normalize input data"). What is the best \(k\) chosen? What does it mean?
b. Predict the MEDV for a tract with the following information, using the best \(k\) :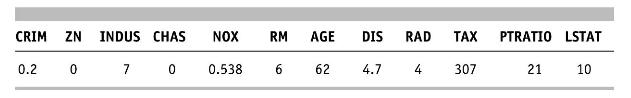
(In a new worksheet, create an identical table with these column names and values, and then in "Score new data" choose "from worksheet.")
c. Why is the error of the training data zero?
d. Why is the validation data error overly optimistic compared to the error rate when applying this \(k-\mathrm{NN}\) predictor to new data?
e. If the purpose is to predict MEDV for several thousands of new tracts, what would be the disadvantage of using \(k-\mathrm{NN}\) prediction? List the operations that the algorithm goes through in order to produce each prediction.
Step by Step Answer:


Data Mining For Business Analytics Concepts Techniques And Applications With XLMiner
ISBN: 9781118729274
3rd Edition
Authors: Peter C. Bruce, Galit Shmueli, Nitin R. Patel
