

Table 5.5 shows a small set of predictive model validation results for a classification model, with both
Question:
Table 5.5 shows a small set of predictive model validation results for a classification model, with both actual values and propensities.
a. Calculate error rates, sensitivity and specificity using cutoffs of \(0.25,0.5\), and 0.75.
b. Using a cutoff of 0.5, create a decile lift chart. First, create a table where column 1 is the decile and column 2 is the lift ratio for each decile. Then, use a bar chart to plot the decile lift chart using the two columns of the table.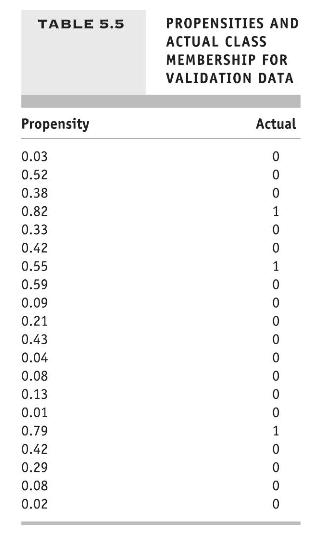
Step by Step Answer:

This question has not been answered yet.
You can Ask your question!
Related Book For 
Data Mining For Business Analytics Concepts Techniques And Applications With XLMiner
ISBN: 9781118729274
3rd Edition
Authors: Peter C. Bruce, Galit Shmueli, Nitin R. Patel
Question Posted:
