

The time plot in Figure 18.10 describes actual quarterly sales for a department store over a 6
Question:
The time plot in Figure 18.10 describes actual quarterly sales for a department store over a 6 -year period (data are available in DepartmentStoreSales.xls, data courtesy of Chris Albright).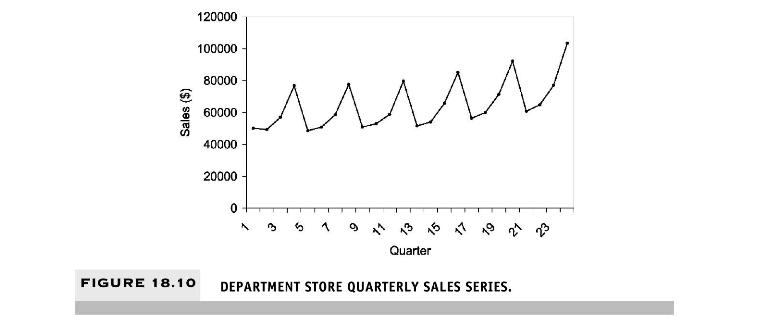
a. Which of the following methods would not be suitable for forecasting this series?
- Moving average of raw series - Moving average of deseasonalized series - Simple exponential smoothing of the raw series - Double exponential smoothing of the raw series - Holt-Winters exponential smoothing of the raw series - Regression model fit to the raw series - Random walk model fit to the raw series
b. The forecaster was tasked to generate forecasts for 4 quarters ahead. He therefore partitioned the data such that the last 4 quarters were designated as the validation period. The forecaster approached the forecasting task by using multiplicative Holt-Winters exponential smoothing. The smoothing parameters used were \(\alpha=0.2, \beta=0.15, \gamma=0.05\).
i. Run this method on the data.
ii. The forecasts for the validation set are given in Figure 18.11. Compute the MAPE values for the forecasts of quarters 21 and 22 for each of the two models (regression and exponential smoothing).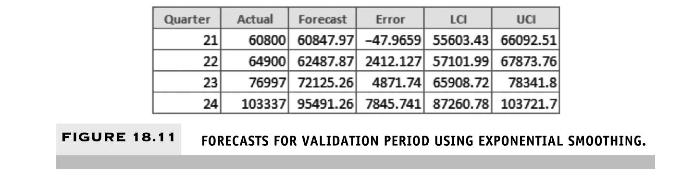
c. The fit and residuals from the exponential smoothing and regression models are compared in Figure 18.12. Using all the information thus far, which model is more suitable for forecasting quarters 21 and 22 ?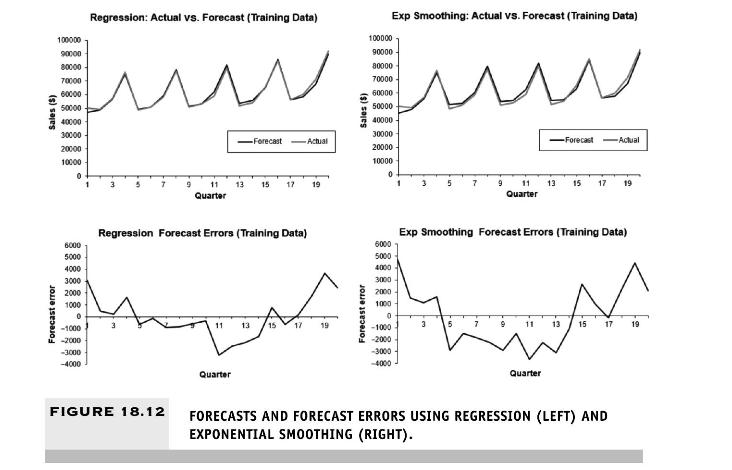
Step by Step Answer:

This question has not been answered yet.
You can Ask your question!


Data Mining For Business Analytics Concepts Techniques And Applications With XLMiner
ISBN: 9781118729274
3rd Edition
Authors: Peter C. Bruce, Galit Shmueli, Nitin R. Patel
