

Question: The time plot in Figure 19 . 17 shows the series of quarterly shipments (in million dollars) of US household appliances between 1985 and 1989
The time plot in Figure 19 . 17 shows the series of quarterly shipments (in million dollars) of US household appliances between 1985 and 1989 (data are available in ApplianceShipments.csv, data courtesy of Ken Black).
a. Which of the following methods would be suitable for forecasting this series if applied to the raw data? • Moving average • Simple exponential smoothing • Double exponential smoothing • Holt-Winters exponential smoothing

b. Apply a moving average with window span w = 4 to the data. Use all but the last year as the training set. Create a time plot of the moving average series.
i. What does the MA(4) chart reveal?
ii. Use the MA(4) model to forecast appliance sales in Q1-1990.
iii. Use the MA(4) model to forecast appliance sales in Q1-1991.
iv. Is the forecast for Q1-1990 most likely to underestimate, overestimate, or accurately estimate the actual sales on Q1-1990? Explain.
v. Management feels most comfortable with moving averages. The analyst therefore plans to use this method for forecasting future quarters. What else should be considered before using the MA(4) to forecast future quarterly shipments of household appliances?
c. We now focus on forecasting beyond 1989. In the following, continue to use all but the last year as the training set and the last four quarters as the holdout set. First, fit a regression model to sales with a linear trend and quarterly seasonality to the training data. Next, apply Holt-Winters exponential smoothing with smoothing parameters α = 0.8,β = 0.5, γ = 1.0 with multiplicative seasonality to the training data.
Choose an adequate “season length.”
i. Compute the MAPE for the holdout period using the regression model.
ii. Compute the MAPE for the holdout period using Holt-Winters exponential smoothing.
iii. Which model would you prefer to use for forecasting Q1-1990? Give three reasons.
iv. If we optimize the smoothing parameters in the Holt-Winters method, are the optimal parameters likely to get values close to zero? Why or why not?
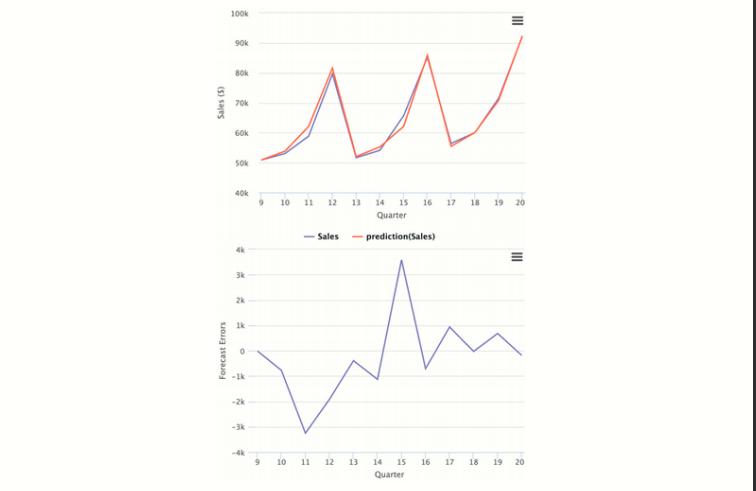
Sales (5) Forecast Errors 100k 90k 80k 70k 60k 50k 40k 9 10 11 12 13 4k 3k 2k -3k -Sales 14 15 16 17 18 Quarter -prediction(Sales) 19 20 Whi -4k 9 10 11 12 13 14 15 Quarter 16 16 1171 18 19 20
Step by Step Solution
There are 3 Steps involved in it

Get step-by-step solutions from verified subject matter experts