

Question: We begin this exercise by showing some data analysis from the Small Student data set. Two variables in the Small Student data set are the
We begin this exercise by showing some data analysis from the Small Student data set.
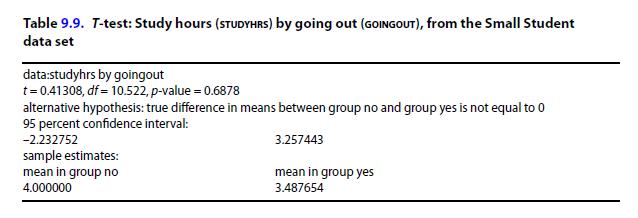
Two variables in the Small Student data set are the number of hours per week students spend studying (studyhrs) and whether or not they are going out (goingout) with someone. Table 9.9 shows the results of the t-test we ran using these variables, with goingout as the binary group variable and studyhrs as the dependent numerical variable. What did we find?
a) Explain what question we asked.
b) What did we find?
Here is another t-test carried out in this data set. We are curious whether hours spent on media is related to academic happiness – satisfaction with the academic side of college life. Academic happiness (happyacadbi) is a binary variable that establishes the two groups for the t-test, and their report of media hours (mediahrsln) is the dependent numerical variable.
c) What do we conclude and why?
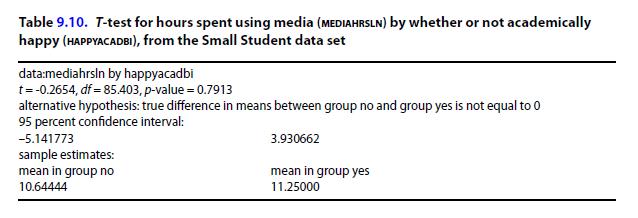
Table 9.9. T-test: Study hours (STUDYHRS) by going out (GOINGOUT), from the Small Student data set data:studyhrs by goingout t=0.41308, df = 10.522, p-value = 0.6878 alternative hypothesis: true difference in means between group no and group yes is not equal to 0 95 percent confidence interval: -2.232752 sample estimates: mean in group no 4.000000 3.257443 mean in group yes 3.487654
Step by Step Solution
3.41 Rating (157 Votes )
There are 3 Steps involved in it
a We asked whether the study hours for people who reported going out with someone were significantl... View full answer

Get step-by-step solutions from verified subject matter experts