

Question: 1. Table 12.2 shows the means, standard deviations, and correlations among the variables used in this chapters example. Reanalyze the five-variable path model. (For users
1. Table 12.2 shows the means, standard deviations, and correlations among the variables used in this chapter’s example. Reanalyze the five-variable path model. (For users of SPSS, the file “motivate 5 var path.sps” on the Web site (www.tzkeith.com) shows how to analyze such a matrix using this program.) Calculate all paths and disturbances to create a table of direct, indirect, and total effects. Make sure your results match mine.
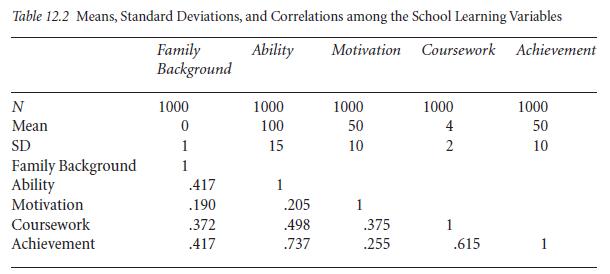
Table 12.2 Means, Standard Deviations, and Correlations among the School Learning Variables Family Background Ability Motivation Coursework Achievement N 1000 1000 1000 1000 1000 Mean 0 100 50 4 50 SD 1 15 10 2 10 Family Background 1 Ability .417 1 Motivation .190 .205 1 Coursework .372 .498 .375 1 Achievement .417 .737 .255 .615
Step by Step Solution
There are 3 Steps involved in it

Get step-by-step solutions from verified subject matter experts