

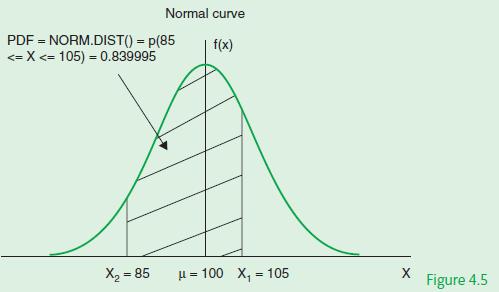
Calculate the probability that X lies between 85 and 105 cm for the problem outlined in Example
Question:
Calculate the probability that X lies between 85 and 105 cm for the problem outlined in Example 4.1.
In this example we are required to calculate P (85 ≤ X ≤ 105) which represents the area shaded in Figure 4.5.
The value of P (85 ≤ X ≤ 105) can be calculated using Excel’s NORM.DIST () function.
Data from Example 4.1
A manufacturing firm quality assures components manufactured and historically the length of a tube is found to be normally distributed with a population mean of 100 cm and a population standard deviation of 5 cm.
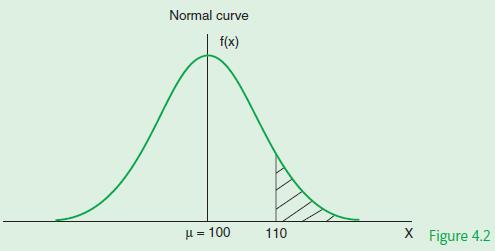
Calculate the probability that a random sample of one tube will have a length of at least 110 cm.
From the information provided we define X has the tube length in centimetres and population mean μ = 100 and standard deviation σ = 5. This can be represented using the notation X ~ N (100, 52).
The problem we have to solve is to calculate the probability that 1 tube will have a length of at least 110 cm.
This can be written as P(X ≥ 110) and is represented by the shaded area illustrated in Figure 4.2.
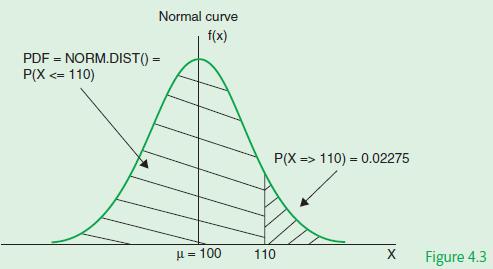
This problem can be solved by using the Excel function NORM.DIST (X, μ, σ2, TRUE). This function calculates the area illustrated in Figure 4.3.
Step by Step Answer:
Th e Excel solution is illustrated in Figure 46 From Excel the NORMDIST fun...View the full answer


